
 This post describes an accurate way to detect the bottleneck in manufacturing systems, based on the average times a process is waiting or active. The method determines the primary bottlenecks in the system much more accurately than other methods commonly used in industry. The method was developed by me during my time at the Toyota Central R&D Laboratories in Japan. Subsequent posts look at other bottleneck detection methods that actually DO work!
The Basics
A machine or process can be in different states at any given point in time. In most cases, we can’t tell whether a process is the bottleneck based simply on the knowledge of the process state. For example, if the process is currently working, it may or may not be the bottleneck.
However, there are some process states where we can tell with certainty that the process is not a bottleneck at a particular moment. For example, if the process is waiting for material, then the process cannot be the bottleneck at that moment. Some other process must starve this current process, hence some other process must be the bottleneck at that time. Below is the list of possible states where the process is definitely not a bottleneck:
- Waiting for Material (starved)
- Waiting for Transport (blocked)
In general, whenever a process is waiting for someone or something else, it is not the bottleneck. Some other process must be the temporary bottleneck at that moment. Hence, there are some instances when we can say for sure that a process is not the bottleneck. In turn, there are a number of process states where the process can be the bottleneck. These may include, for example:
- Working (hopefully most of the time)
- Breakdown
- Under Repair
- Regular Maintenance
- Changeover
For the following discussions, we call these states active (in the sense of not waiting) and the above waiting states inactive.
Duration without Waiting Determines Bottleneck
The basic idea of this method is that the longer a process is active without interruption by a waiting time, the more likely it is the bottleneck. A process frequently interrupted by waiting times is unlikely to be the bottleneck. This is the fundamental underlying idea for the next two methods for determining the bottleneck. In both cases, we measure the duration that each process is active without interruption. Please note that if, for example, the process goes from working to repair to working without ever having to wait for material or transport, it is considered one uninterrupted active period.
The Average Active Period Method
The Average Active Period Method simply measures the average active time a process is active. In most cases, one process (or at most, two) will clearly stick out, having a much longer average active period than any other processes.
Below is an example of such an analysis. A system consisting of eight processes in line was analyzed. The cycle times were all around five minutes, with random variation from cycle to cycle. Measuring the average active period, one process (M4) clearly stuck out with an average active duration of about 15.000 minutes. In other words, the process was working for 15.000 minutes in average before being interrupted by a waiting time (i.e., before being interrupted by another process). This was by far the longest average active period in the system. All other processes barely showed up on the graph, with an average working only for one or two cycle times before being interrupted by waiting for another process.
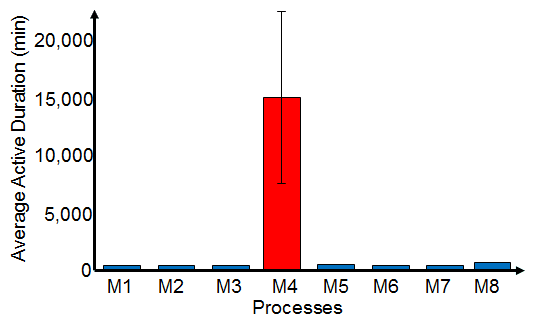
To be on the safe side, I also calculated the confidence intervals of the average active periods. Naturally, the confidence interval of the bottleneck process M4 was wide, indicating that the average active duration was fluctuating. Also, while rare, the process M4 was sometimes waiting on one of the other processes. Nevertheless, the confidence intervals of the active periods of the other processes were much smaller, also in the magnitude of a few cycle times. It was above 99% certain that process M4 had the longest average active period. Hence the result was very clear. Process M4 was definitely the primary main bottleneck in the system.
How Did I Find that Method?
I initially found this method by making a mistake. During my time at Toyota, I was researching production systems. For this I programmed myself a small simulation with a number of processes in series, having randomly distributed cycle times. Just for kicks I decided to measure the average cycle time.
After running the simulation, most results turned out reasonably well. These average cycle times were all on the magnitude of the mean cycle time of the random distribution I used, albeit a bit on the high side. However, one process stuck out. Rather than having the average cycle time I expected, it was around 10.000 times that!
Puzzled, I decided to investigate further. It turns out that I had a small bug in my program. Rather than measuring the cycle times, I had measured the sum of all cycle times without interruption by waiting times. After fixing that bug, I got the results I expected.
However, this got me thinking. Why on earth did one process stick out so much? Well, it turned out that this was the slowest average cycle time and, in this case, the bottleneck. Voila, by making this mistake I found my method to detect the bottlenecks!
Some Special Situations
Above, I stated that the process cannot be the bottleneck whenever it is waiting for material or transport. There are a few more situations where it may not the bottleneck, but this depends on your view on the analysis.
For example, the process could also be waiting for an operator or for a mechanic. In this case, you have to decide if you want to consider the operator and/or the mechanic a separate entity in your bottleneck detection. If you do, then the process is inactive at that time. However, for simplicity purposes I usually consider operators and mechanics to be a part of the working process. Hence If there is a missing operator, the process (with operator) could still be the bottleneck, rather than having the operator only as the bottleneck.
Other Posts in this Series on Bottlenecks
- Shifting Bottlenecks
- Common Bottleneck Detection Methods that do NOT work!
- Mathematically Accurate Bottleneck Detection 1 – The Average Active Period Method
- Mathematically Accurate Bottleneck Detection 2 – The Active Period Method – My preferred method if you have lots of data (e.g. from a simulation)
- The Bottleneck Walk – Practical Bottleneck Detection Part 1 – My preferred method on the shop floor
- The Bottleneck Walk – Practical Bottleneck Detection Part 2
References
- Roser, Christoph, Masaru Nakano, and Minoru Tanaka. “A Practical Bottleneck Detection Method.” In Proceedings of the Winter Simulation Conference, edited by Brett A Peters, Jeffrey S Smith, D. J Medeiros, and Matt W Rohrer, 2:949–953. Arlington, Virginia, USA: Institute of Electrical and Electronics Engineers, 2001.