
 There are different ways to calculate an OEE. I know of at least three different ways. However, some of them are easier and more practical than others.
Maybe you have seen a formula similar to OEE = A x P x Q. I see this formula often, but for me it is a very impractical way to calculate the OEE. Let me show you why by comparing the three different ways to calculate an OEE.
Example Data
 Throughout this post I will be using examples. To calculate an OEE, we need a few data points. Our example process will be as follows:
- Total Time: Total time the process is scheduled to work, 5 days with 24 hours each or a total of 7200 minutes
- Downtime: Machine stopped for whatever reason: 1440 minutes
- Cycle Time: Needed to produce one unit: 1.5 minutes/unit
- Good Units: Total number of good parts produced during the 5 days: 2880 pieces
- Defective Units: Total number of defective parts produced during the 5 days: 240 pieces
The Impractical Formula

In literature you sometimes find the following formula for the OEE:
\[ OEE = A \cdot P \cdot Q \]where
- A is the availability rate, the ratio of the time the machine is running vs. the total time in consideration.
- P is the performance efficiency. This is calculated based on the ideal time needed to produce the parts (including defective parts) divided by the total running time of the process.
- Q is the quality rate. This is simply the number of good parts divided by the total number of good and bad parts produced.
A, P, and Q for our example are calculated below.
\[ A = \frac{Total Time – Downtime }{Total Time } = \frac{7200 min – 1440 min}{7200 min} = 80 \%\] \[P = \frac{(Good Units + Defective Units) \cdot Cycle Time }{Total Time – Downtime } = \frac{(2880 pcs + 240 pcs) \cdot 1,5 \frac{min}{pcs}}{7200 min – 1440 min} = 81.25\%\] \[Q = \frac{Good Units }{Good Units + Defective Units} = \frac{2880 pcs }{2880 pcs + 240 pcs} =92.31\%\]Hence the overall OEE according to the APQ formula is:
\[ OEE = A \cdot P \cdot Q = 80 \% \cdot 81.25\% \cdot 92.31\% = 60.0\%\]You can already see that this is quite a bit of work to calculate.
The Easy OEE by Pieces

If you need only the OEE, there are much easier ways to calculate it. One is by using the ratio of good parts produced vs. the number of parts that could have been produced. Hence
\[ OEE = \frac{Good Units }{\frac{Total Time }{Cycle Time }} = \frac{2880 pcs }{\frac{7200 min}{1,5 \frac{min}{pcs}}} = \frac{2880 pcs }{4800 pcs }= 60.00\%\]The Easy OEE by Time
Above we calculated the OEE by dividing the good units by the total number of units that could have been produced. You can calculate the OEE similarly by using time. You divide the duration that you would have needed at a minimum by the time you actually needed.
\[ OEE = \frac{Good Units \cdot Cycle Time }{Total Time } = \frac{2880 pcs \cdot1,5 \frac{min}{pcs }}{7200 min} = \frac{4320 min }{7200 min } = 60.00\%\]Why A x P x Q is bad
Much More Complex
It is easy to see that the calculation through pieces or through the time is much easier and simpler. The A x P x Q approach is much more complex, and hence has a much higher likelihood of mistakes. The formula is error prone not only because there are more calculation steps, but also because you have to always pay attention when you use the total time, or only the time the machine is actually running, when to use all parts, and when to use only the good parts, and so on. I find it very confusing (but admittedly I used the other way much more frequently).
Same Result
Additionally, if we put the entire complex formula together, we can easily cancel out many terms.
\[OEE = \frac{Total Time – Downtime }{Total Time } \cdot \frac{(Good Units + Defective Units) \cdot Cycle Time }{Total Time – Downtime }\cdot\] \[\cdot \frac{Good Units }{Good Units + Defective Units} \]Rearranging this gives us:
\[ OEE = \frac{Total Time – Downtime }{Total Time – Downtime } \cdot \frac{Good Units + Defective Units }{Good Units + Defective Units} \cdot \frac{Good Units \cdot Cycle Time}{Total Time } \]Many of the terms cancel out easily, which leaves us with
\[ OEE = \frac{Good Units \cdot Cycle Time}{Total Time } \]which is exactly the formula we had for the Easy Way by Time above.
What about the Losses?

Your OEE is below 100% due to losses. These losses are typically grouped in availability losses, speed losses, and quality losses. To know how big your losses are will help you with actually improving the system.
With the A x P x Q formula, you get something that at least sounds similar – the availability rate, performance efficiency, and quality rate. I think breaking down the OEE in these three terms is the reason the calculation is done the way it is in the first place. However, I still think it is impractical.
You could hope that the corresponding terms sum up to 100%. Unfortunately they do not! Only the availability rate and the availability losses together give 100%, but the speed loss is not complementary to the performance efficiency, and the quality rate is again not complementary to the quality losses. They are completely different numbers! Let’s do the math.
Availability Losses and Availability Rate

The availability losses are the part of the losses that you lose due to stopped machines. This is usually calculated by time, since the total time and the stops are usually given as times.
\[Availability Losses= \frac{Downtime }{Total Time } = \frac{1440 min}{7200 min} = 20\%\]It is also possible to calculate this through the number of parts, but since this usually involves more math, the above way is easier. In any case, the losses are the same. Below, for reference, is the marginally more complex calculation using the number of parts:
\[ Availability Losses= \frac{\frac {Downtime } {Cycle Time}}{\frac {Total Time } {Cycle Time}} = \frac{\frac{1440 min}{ 1,5 \frac {min}{pcs}}}{\frac{7200 min }{ 1,5 \frac {min}{pcs}}} = 20\%\]The availability losses and the availability rate together give exactly 100%.
\[Availability Losses + Availability Rate = 20 \% + 80 \% = 100\% \]Quality Losses and Quality Rate

The quality losses is the time lost due to defective parts. This can also be done either by calculating through the time or through the quantity. Let’s do the calculation by lost time first:
\[ Quality Losses= \frac{Defective Parts \cdot Cycle Time}{Total Time } = \frac{240 pcs \cdot 1,5 \frac {min}{pcs}}{7200 min} = 5\%\]The calculation by lost quantity is equally simple and gives the same number:
\[ Quality Losses= \frac{Defective Parts}{\frac {Total Time }{ Cycle Time} } = \frac{240 pcs}{\frac {7200 min}{ 1,5 \frac {min}{pcs}} } = 5\%\]However, the quality losses and the quality rate are no longer complimentary.
\[ Quality Losses + Quality Rate = 5 \% + 92.31 \% = 97.31 \% \neq 100\% \]Speed Losses and Performance Efficiency
 Finally, the speed losses. I kept these losses for last, as the speed losses are simply the remainder to 100%.
Again, the speed losses and the performance efficiency are no longer complimentary.
\[ Speed Losses + Performance Efficiency = 15 \% + 81.25 \% = 96.25 \% \neq 100\% \]Overview of Losses
Here’s a quick overview of the different values, and it is easy to see that they differ. The different losses or efficiencies are not complementary (except for availability).
| Easy Oee | Value | Value | A×P×Q = OEE |
|---|---|---|---|
| Availability Losses | 20% | 80% | Availability Rate |
| Speed Losses | 15% | 81.25% | Performance Efficiency |
| Quality Losses | 5% | 92.39% | Quality Rate |
| OEE | 60% | 60% | OEE |
In fact, they must differ. After all, the A x P x Q formula is a multiplication, and the other one sums up to 100%
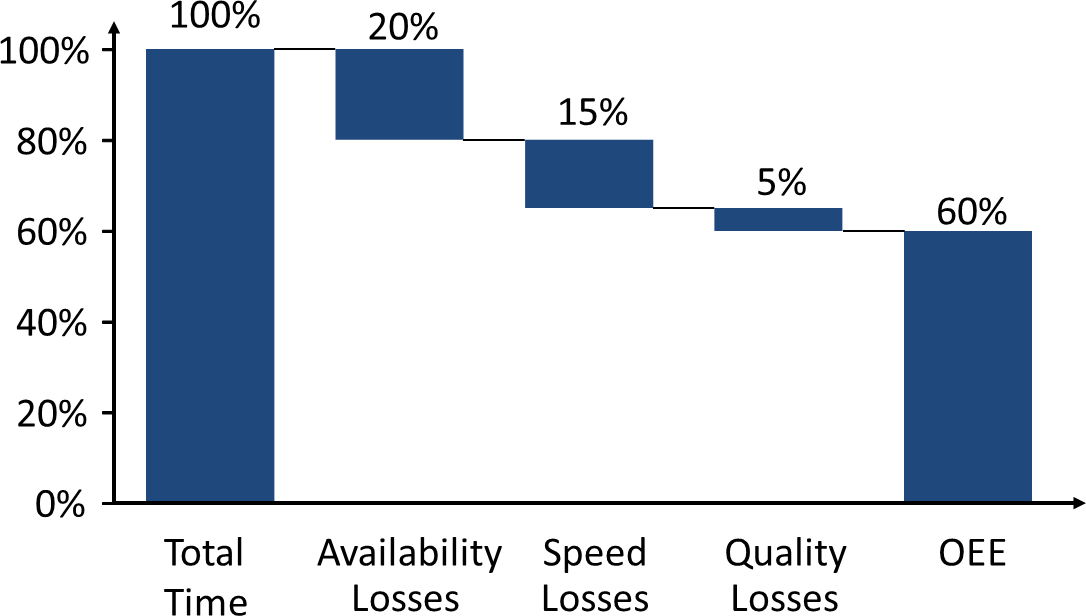
\[ OEE= Availability Rate \cdot Performance Efficiency \cdot Quality Rate\] \[ OEE + Availability Losses + Speed Losses + Quality Losses = 100 \%\]For me, it is quite obvious that summing up the losses has significant benefits. It is easier to see which part of the losses contributes how much to the total losses. This also makes it much easier to estimate how much a system will improve based on different improvement actions. Below is a simple waterfall bar chart showing which part of the losses contributes how much to the overall OEE losses.
Regarding the product in the A x P x Q formula, however, I fail to see any benefit. Hence my recommendation: Do not use the A x P x Q formula! If you know of any reasons, please enlighten me. Until then I will continue to advise you to avoid the A x P x Q formula, and instead use one of the two easy ways described above. Now, go out and organize your industry!
‘Performance’ is a vague word. ‘Utilisation’ clearer, and embraces factors such as not filling every pocket, or operators absent, parts missing etc.
Hi Christoph,
I go even thurther!
I more or less eliminated the OEE- approach out of my lean toolkit. If we already have this kind of discussions between us, how can we expect to get the OEE- thinking/ understanding into our shop floor people. As we need to manage the shop floor and want the involvement of the operators, I started already a few years ago to track unplanned downtime, which is very simple to understand and measure.
If you look into OEEs of most pieces of equipment, unplanned downtime is the major equipment loss anyway, second being usually scrap/ rework (which is usually separated measured anyway). This two things usually create already more than enough problem solving activity.
So let us focus on that these 2 first, before we talk about speed losses.
Furthermore, OEE is a metric which supports the local optima appoach, which as we know is only really improtant, if we speak about a bottleneck process.
Regards
Dirk
Great review of OEE here and the components. I have authored the same equations in eVSM software so it can ask the lean practitioner for the components like changeover times, downtime, scrap etc.. directly and calculate the OEE as above.
OR, if OEE numbers are available directly they can type them in.
OR if they know the number of good parts, they can input it this way.
Goal is to take the information that is easily available, as you say and without tedious calculations on the users part.
One of the most useful outputs of all this is a Cycle Time/Takt Time chart that shows each of the losses to scale so you can understand the impact on capacity and in light of the demand. With scrap there is the rolling effect of having to make more parts upstream and this should be reflected on the plot also.
Look forward to the next blog. Really enjoy these.
Hi Steve, in the above context Performance Efficiency are the equivalent of speed losses, whereas missing material would be availability and defective parts quality. In any case, I don’t like the Performance Efficiency anyway. Cheers, Chris
Hi Dirk, I think the OEE can be very useful to improve a particular machine, but I do not like the shotgun approach to measure the OEE everywhere either. As for your approach, in my experience speed losses are often the largest loss groups, and also a group that you usually cannot measure directly. Downtime and scrap only would miss a big piece of the losses – although this is usually a hard to improve piece. Cheers, Chris
Hi Dilesh, many thanks 🙂 . Cycle Time / Takt time is very useful, it is also the same as the OEE. Cheers, Chris.
In my past experience I spent hours and hours in collecting data to calculate OEE!
What a waste!
First: Why and where I need OEE?
Second: Use the approach you proposed is fast and effective.
At the gemba please! Then OEE.
Great Chris.
Availability and utilization are not supposed to be the same thing. The availability of a resource is the probability that you can use it when you need it; it’s utilization, the fraction of the total time that you use it. A pen that always works whenever you need to jot down dome notes has 100% availability; if you use it 1 hour every day, it’s utilization is about 4%.
Confusing the two in OEE calculations makes using all machines all the time appear to be high performance.
More generally, if you want to make any use of OEEs, you need to break them down into their factors, and you might as well focus directly on them: availability, speed losses, and quality losses. Like unit cost, OEE is an overly aggregated metric, whose use can easily do more harm than good.
Hi Michel, I always like your clarity and precision in using words 🙂
How do you change the formula if they have different cycle time ?
Hi Ricardo, if you rparts have different cycle time, then you would have to calculate by time. e.g. if you make 2000 parts A and 5000 Parts B in an 8 hour shift, then your perfect time would be 2000 x Cycle time A plus 5000 x cycle time B. The OEE would be this perfect time divided by the 8 hours (make sure the units match). The quality losses are calculated similarly using the individual cycle times. Speed losses and availability losses remain unchanged.
Hope this helps,
Chris
Which ever way you calculate it doesn’t really matter especially as the majority of people do it on a spread-sheet so only a few entries required.
The important thing is that the data is accurate and you act and improve as a result of the data.
If you can’t see an improving trend in Performance then either your data or your actions are incorrect
Please, could you give me chart of waterfall O. E. E. thanks in advance.
Wael, there is a waterfall chart at the bottom of the article.
Hi Christoph,
very good explanantion but now I am a bit confused between OEE and TEEP.
You mention:
OEE = (Good Units * Cycle Time) /Total Time
In this case what will be the TEEP then?
Thanks for your help in advance!
Pl clarify somebody…… Set up time is to be consider as planned downtime or unplanned downtime
Hi Prakash, it is usually a planned downtime, as you know that the setup will happen. But it all depends on how you define the words in your company.
Hi Christoph,
I’ve found a journal that said speed efficiency influenced OEE. If speed efficiency increase so does the OEE. So to clarify this, i calculate the OEE using the formula (OEE=availability x Performance x quality) by replacing performance with speed efficiency. From the result, i compared both OEE with SE & PE respectively. There is a slight improvement for OEE between those two.
Thank you and am looking forward for your response.
Hi Daniel, it depends on how you define speed efficiency. For the AxPxQ Formula to work, Performance and speed efficiency would have to be the same. In my experience, the Performance part is the most difficult one to measure anyway.
Great article Christoph. I’m very much aligned with your logic around using a more practical and useful method for OEE. I’ll add that by using this method, it’s easier to tie OEE and losses directly to plant financials since it’s more of a representation of how operational time (and costs) are consumed.
Would love to demonstrate our new software called Impruver that applies the method you described above plus root cause analysis, action and accountability management, strategy deployment, one point lessons and several other tools.
You can learn more about the software at https://impruver.com
Let me know if you’d be interested in a live demo and perhaps we could do a joint blog post, case study, podcast, or other content collaboration.
Hallo Christoph, I have question regarding cycle time. While calculating OEE which time we need to taken into consideration, whether cycle time of the machine or the cycle time of the worker. What to do if we have cycle time of machine is faster than the cycle time of worker.
If we take cycle time of machine, we can see it`s effect on worker Performance.
So, which is the right way to calculate OEE?
It would be helpful if you can share your insight related to it.
Thanks in advance.
Regards
Hi Ravikumar,
for the OEE of the machine use the cycle time of the machine. For the OEE of the worker (i.e. the OPE) use the cycle time of the worker.
Dear Christoph,
regarding the loss calculation, why don’t you multiply the loss percentages as in AxPxQ? e.g. 1-92,31%= 07,69% 1-81,25%=18,75% 1-80%=20% So all multiplied makes 2880 which accounts for 60% OEE. 2880/60= 48 which is 1% of total.
48×100*1,5=7200 (your theoretical available time)
Hi Abraham, the math works out either way, but I think the multiplication approach is much more complex.
By comparing 2 maths on the OEE (simple and complex), found that calculation result is different when involved 2 different cycle times.
Example:
Good units: 2880 which from
1) Order 1: 1000, cycle times 1.5 minutes/unit
2) Order 2: 1880, cycle times 2.0 minutes/unit
With complex calculation (A*P*Q), below is the result
A: 80% (same)
P: ((1000 * 1.5) + (1880 * 2.0)) / 5760 = 91.3%
Q: 2880 / 3120 = 92.31% (same)
OEE = A * P * Q = 67.42%
But if calculated by simple logic, then will be
OEE = ((1000 * 1.5) + (1880 * 2.0)) / 7200 = 73.06%
Both calculation was returned different result due to the complexity. I am confused which OEE shall be appropriate to apply? If my calculation is wrong, appreciated could guide me on the right calculation.
Thanks.
Hi PG, For different cycle times it becomes more complex. It took me quite some time, but I figured out two mistakes in your calculations.
P: You included only the times for good parts, but C also needs to include the times for bad parts. Since you did not give a ration of bad A and bad B I assume for the following that 100 parts A are bad and 140 parts B, giving a total of 240 (as before). In this case your formula changes to P: (((1000+100) * 1.5) + ((1880+240) * 2.0)) / 5760 = 5690/5760 =98.8%
Q: Since the two parts take different times, you need to switch to a time based calculation to account for the cycle time differences. P becomes the TIME FOR good parts divided by the total TIME FOR good and bad parts produced. Hence Q = ((1000 * 1.5) + (1880 * 2.0))/ (((1000+100) * 1.5) + ((1880+240) * 2.0))=5260/5690=92.4%.
Multiplying 80%*98.8%*92.4* gives 73.1%, which is the same as for the normal OEE.
I think this proves my point that the “good way” to calculate an OEE above is much easier than the AxPxQ. Cheers!
Thanks Christoph for your reply, your feedback is very helpful on understanding the OEE calculation. Appreciated.
Dears,
I agree that there is no reason to have a lot of engineers spending hours and hours in calculating OEE… too much time for calculation is a waste of time!
I have tried to summarize my thoughts in this video:
https://www.leanvlog.com/oee-calculation-overall-equipment-effectiveness/
Oee by department also has its benefits
Hi Christopher:
Thanks for detailed breakdown on OEE Losses. Understand the availability, Perf Eff and Quality Loss points. If we have to answer, how many OEE points is say for example 5 points loss from Quality or 15 points loss from Speed? Is there a rational calculation to determine how many OEE Points we have lost or in other words, how many OEE points can we gain back from these 15 speed loss points or 5 quality points or 20 avaialbility points?
Thanks
Vinny
Hi Vinny, this is exactly the reason why I recommend to use the easier (second) method in this post. If you use the second approach, a 5% quality loss would also be a 5% OEE loss.
Hello Christoph,
I have been using a version of OEE for over a year know for my packaging team. We use start and stop times of packaging runs as the “shift times” so it is a bit different. However I believe the logic still applies and we have gathered some great data and been able to reduce downtime by 10% during operation. My question to you is about reduced speed. We have a formula that will auto populate reduced speed during the run based on length and cycle times. When calculating performance though I am unsure if I should remove units produced during reduced speed? I currently am not using the reduced speed time in the equation as the percentage can go over 100% if I add that time under downtime. I hope this makes sense?? Thanks for any insight.
Hi Elliot. Not sure what exactly you mean with “reduce speed”. Is it a setting for your machine? Is it a calculation tool to determine the speed?
In any case, every good part counts to the OEE. If you ideally need 10 seconds to make a part, but you make one in 12 seconds, then you have a 2 second speed loss. Usually, speed losses are hard to catch. Often, it is only “the remainder” of all other losses.
Hope this helps,
Chris
Reading it for the 100th time finally saw where I went wrong. I was trying to exclude reduced speed from Run Time. It is supposed to be part of run time which then makes this make a lot more sense! Thanks for the help!
Glad we found the glitch 🙂
Hi Chris,
thank you for your posts! Regarding the cycle time within the easy way of calculation: From a value stream / time analysis perspective, is the cycle time the (net) cycle time when the machine is running at regular speed? So when I am looking at the machine and there is no reduced speed nor a downtime for a 15 minutes and I am counting the pieces, e.g. 5 pieces, over that time span; this would yield into the cycle time, right? So 15 minutes / 5 pieces = 3 min/pcs as cycle time?
Thank you,
Tom
Hi Tom, your approach probably gets close, but it will be more accurate to measure the actual time between departing parts, and then use a median or a 20% percentile or similar. I have two posts on How to Measure Cycle Times for more details
Hi Chris,
thank you for your answer and the hint concerning the posts on how to measure cycle times. I actually take the same approach with the median or a 20% percentile. The important point you mention is, looking at the process data for the time measurement and reflect it on the actual production process and how the manufacturing operations are done. I also found the link to Michel Baudin’s Blog very helpful.
On a personal note: How do you think about Erlach’s approach (Value Stream Design, 2013, Springer) looking at gross cycle time as a sum of net cycle time and cycle times for losses through changeover, breakdowns and quality defects? I am eager to hear your opinion on this 🙂 Thank you in advance!
Best regards,
Tom
Hi Tom, If I understood correctly, then I would call “Gross cycle time” “takt time”. For me, a takt includes all losses. The most famous takt is the customer takt, but there is also the line or process takt (which is the average speed including losses). Also important to check if your line takt matches your customer takt.
Hi,
I think with this approach you will loose a lot of information and weight the losses different. The Problem I see is that the AxPxQ shows the OEE in 3 dimensions the losses approach only in one. Imagine this scenario:
Total planned production time 8 hours
Downtime: 4 hours
Cycle Time 1 minute
good parts 60
reworked parts 60
This results in a OEE of 12.5
The AxPxQ factors are 50% x 50% x 50%
The Losses are: A-50% P-25% and Q-12.5%
If I am able to fix my problems in one dimension I will have a OEE of 25%
With the losses I am thinking I only need to work on the availability to to gain 50%.
But this is wrong.
I think you should do simple things simple. But to oversimplify you loose information.
A correct approach for the losses in this example would be:
OEE: 12.5%
Performance loss: 12.5%
Availability loss: 12.5%
Performance loss: 12.5%
Combination A+P loss: 12.5%
Combination A+Q loss: 12.5%
Combination P+Q loss: 12.5%
Combination A+P+Q loss: 12.5%
I don’t like this but this shows the reality. I prefer to stay with the factors which shows the 3 dimensions with the same weight.
Your losses approach makes things simple but its weighting things in a wrong manor.
Kind regards,
Robin
Hi Robin, I am not sure if I can follow your numbers completely. You are right at one point, if i have an availability loss of 50%, then eliminating it would not give me 50% more parts, but 50% more parts minus the speed losses and the quality losses. Still, I like the A+P+Q more than the A*P*Q approach. But both would work.
Hi Christoph,
Reducing the calculation of OEE from A*P*Q to 𝑂𝐸𝐸=(𝐺𝑜𝑜𝑑 𝑈𝑛𝑖𝑡𝑠 × 𝐶𝑦𝑐𝑙𝑒𝑡𝑖𝑚𝑒)/(𝑡𝑜𝑡𝑎𝑙 𝑡𝑖𝑚𝑒) is wrong and flauting with statistics. OEE = Probability(Run Time ∩ Net Run Time ∩ Productive Time). Only in case Run Time, Net Run Time and Fully Productive Time are independent events 𝑂𝐸𝐸=𝑃(𝑅𝑢𝑛 𝑇𝑖𝑚𝑒)∙𝑃(𝑁𝑒𝑡 𝑅𝑢𝑛 𝑇𝑖𝑚𝑒)∙𝑃(𝐹𝑢𝑙𝑙𝑦 𝑃𝑟𝑜𝑑𝑢𝑐𝑡𝑖𝑣𝑒 𝑇𝑖𝑚𝑒)=𝐴∙𝑃∙𝑄, if these events are not independent, the calculation becomes more complicated and almost impossible to calculate.
𝑂𝐸𝐸=(𝐺𝑜𝑜𝑑 𝑈𝑛𝑖𝑡𝑠 × 𝐶𝑦𝑐𝑙𝑒𝑡𝑖𝑚𝑒)/(𝑡𝑜𝑡𝑎𝑙 𝑡𝑖𝑚𝑒) is only correct if you know the full populations of Run Time, Net Run Time and Fully Productive Time events. This is also the reason all given examples work, but in reality all data over for example 15 years of production will not be available. Therefor you can only take samples and calculate the three factors. Using the three factors, you than can calculate OEE KPI for the given interval.
Kind Regards,
Marc
Hi Marc, the A*P*Q way of calculating also has fans, but I much rather prefer the other way. In both ways the challenge is to get good data, and especially the cycle time leaves lots of room for discussion. But if you know how long it took and how long it should have taken, then the OEE calculation is a breeze, regardless of dependent probabilities.
if zero parts are produced in the period would the quality rate be 100% or 0%
Hi Chris, this is a division by zero, which is meaningless. If you don’t have any parts, then any quality rate has no meaning.