
 On the shop floor it is common wisdom to find the bottleneck based on the inventory. If the buffer is full, the bottleneck is downstream. If the buffer is empty, the bottleneck is upstream. Is this true? My student Carolin Romeser and I spent quite some time verifying this, and found some interesting results. In general it is true, but … the devil is in the details.
Introduction
First, we need to define a bottleneck exactly:
Bottlenecks are processes that influence the throughput of the entire system. The larger the influence, the more significant the bottleneck
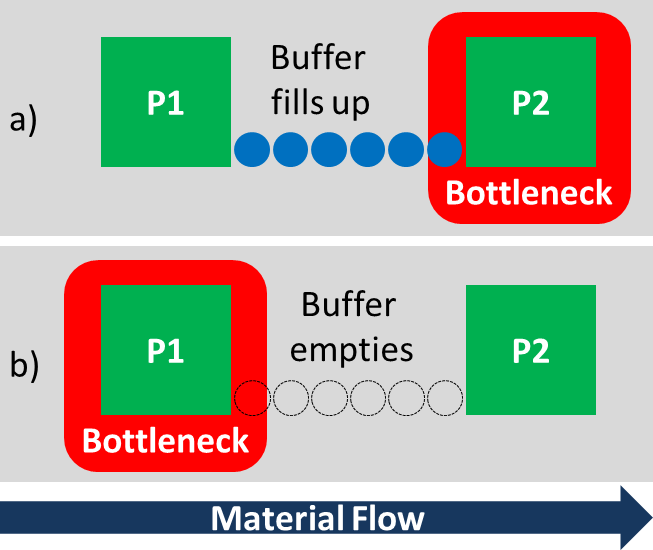
In a production system (or also other systems), a buffer fills up if the bottleneck is downstream and the buffer empties if the bottleneck is upstream as shown in a) and b) below. The bottleneck is the cause, and the buffer behavior is the effect.
Now, in industry and also many academic papers and methods (mine included), this relation is then used to find the bottleneck:
- If the buffer is (rather) empty, then the bottleneck must be (probably) upstream
- If the buffer is (rather) full, then the bottleneck must be (probably) downstream
It is easy to imagine examples where the above industry relation is not true. Take the example below. Initially, process P1 is the bottleneck, and the subsequent buffer is empty. If the bottleneck shifts to P2, the buffer starts to fill up. Now, assume that the buffer becomes full just before the bottleneck shifts back! Process P1 would never have to wait for P2.
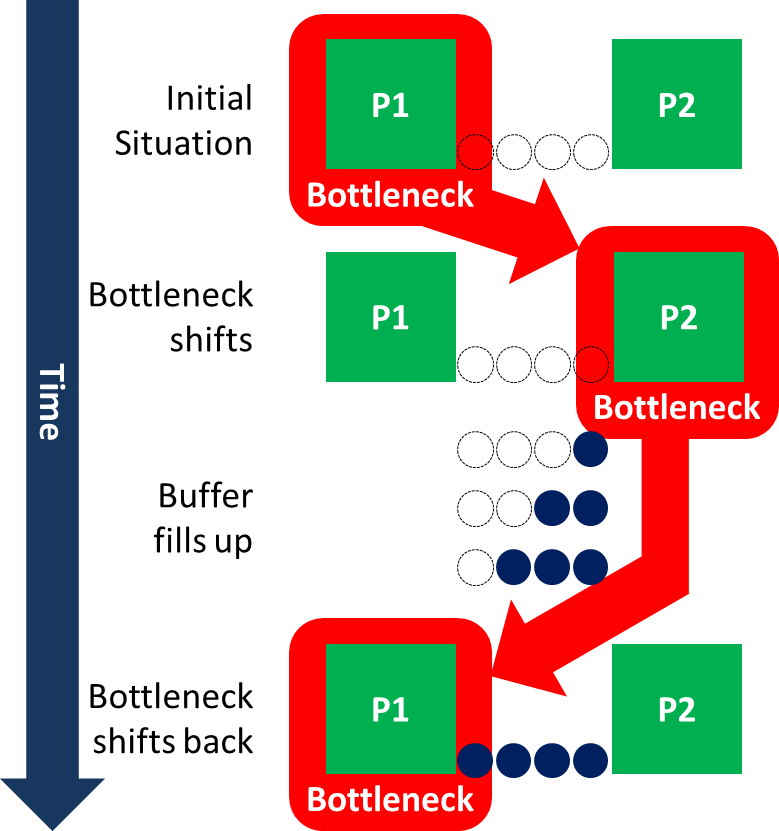
I marked the processes above as bottleneck. However, according to our definition of the bottleneck above, the bottleneck has to influence the overall throughput of the system. Yet, in the example above, it was always P1 that influenced the entire system. Just before P2 would have an influence, the bottleneck shifted back to P1. Despite a completely full buffer, P2 was actually never the bottleneck!
Granted, this is an extreme but quite possible situation. Hence, even with a completely full or empty buffer it can never be said with certainty where the bottleneck is, only with a probability.
The Theoretical Expectation
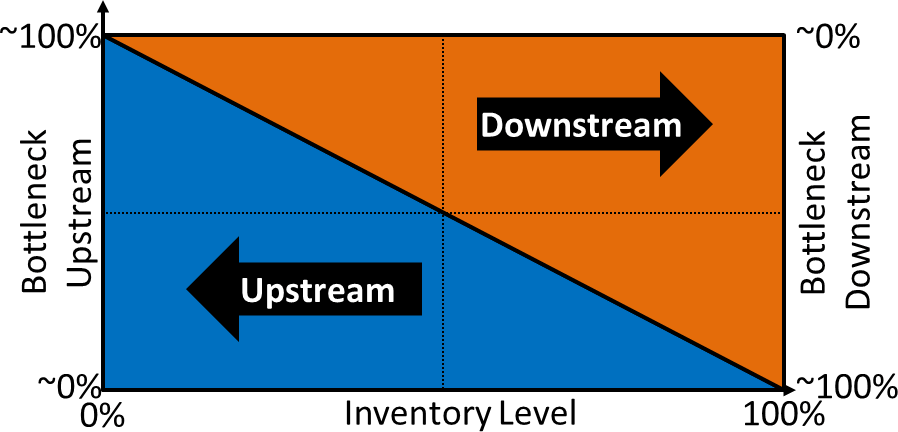
In theory, you would expect that the probability of the bottleneck being upstream or downstream is directly related to the inventory level. If your buffer is full, you can be almost sure that the bottleneck is downstream. If your buffer is empty, you can be almost sure that the bottleneck is upstream. For any inventory level in between you have a linear relationship. If your buffer is exactly 50% full, then the bottleneck may be equally likely up- or downstream.
The Yardstick: Active Period Method
Despite quite a bit of literature research, we did not find any prior research. Lots of people both in industry and academia use this assumption to find bottlenecks, but so far no one has checked if this is actually true. Hence, we set out to test this hypothesis.
There is a conundrum. To test the relation of the inventory level and the bottleneck direction you would need to find the momentary shifting bottleneck. However, most methods use exactly this relation to find the bottleneck. Hence, it would be a self fulfilling prophecy if you measure the accuracy of a tool using exactly this tool.
Luckily, I developed an alternative method to detect shifting bottlenecks: the Active Period Method (read more on my post Mathematically Accurate Bottleneck Detection 2 – The Active Period Method)
- Process is inactive if waiting for another process
- Process is considered active otherwise
- The Process with the longest uninterrupted active period is the bottleneck at this time
- Overlap of longest periods are shifting bottlenecks
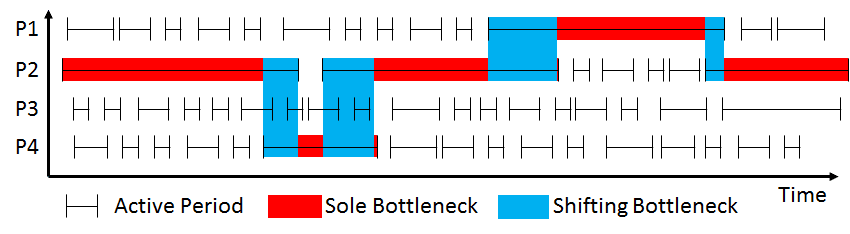
Now we can say at any given time where the bottleneck is, or if the bottleneck is shifting.
Simulation System
We used a simple simulated system with infinite supply and demand, two processes with random cycle times, and a buffer in between.

We run the simulation and recorded both the buffer level and the bottleneck location. In fact, we repeated this for many different systems with e.g. different mean cycle times (from equal to one process being 20% of the other), different random distributions (exponential, erlang, …) and different buffer levels (capacity ranging from three to 100 parts).
Reasonable Symmetric System
For a reasonable symmetric system where the cycle times of both processes are similar, the simulation result is very close to the theoretical result. Below are the results for a system with two identical exponential distributed process cycle times and a buffer capacity of 10. The confidence intervals are also shown.
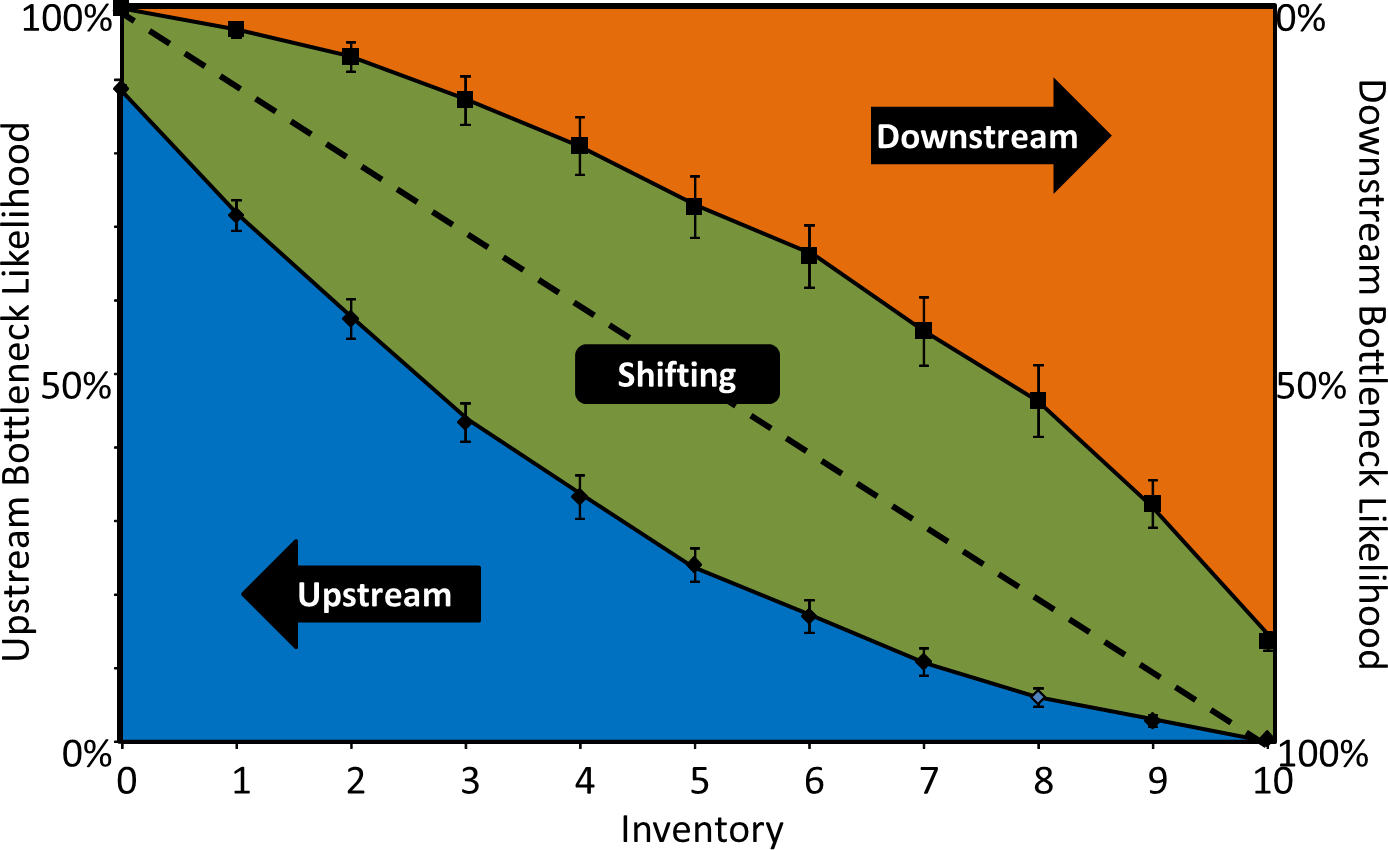
The results are as expected: If your buffer tends towards empty, it is much more likely (but not certain) that the bottleneck is upstream. Similarly, if the buffer tends towards full, it is much more likely (but not certain) that the bottleneck is downstream. Due to the active period method sometimes having a shifting period, we did not always know the bottleneck. The green area in the center represents this shifting period.
Hence, if you find 2 out of 10 pieces in the buffer, then there is an ~55% chance that the bottleneck is upstream, still a ~7% chance that the bottleneck is downstream, and a remaining ~38% chance were the active period did not give a result due to shifting of bottlenecks.
Hypothesis confirmed, you would say? Not so fast!
Lopsided System
We also run simulation experiments with lopsided systems, where one process was faster than the other process. Now, our theoretical model breaks down. Below are the simulation results for process P1 having 20% of the cycle time of P2, hence P1 was much, much faster.
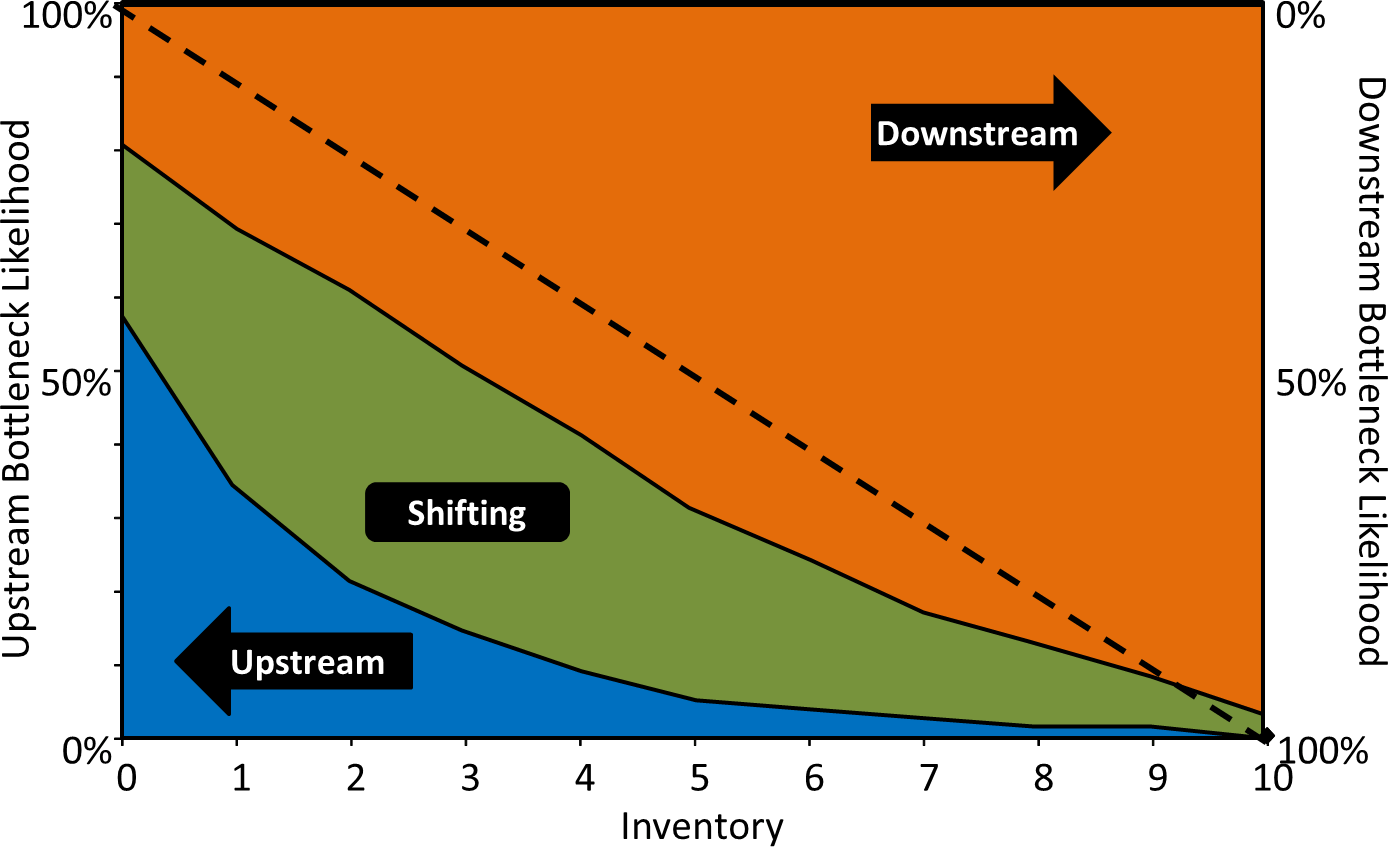
Clearly, it is no longer symmetrical. No matter what the inventory, the bottleneck is almost always downstream. Take for example an inventory level of 2. Rather than a likelihood of 55% upstream and 7% downstream, we now have only a much smaller chance of around 20% upstream and a much larger chance of 40% downstream (and a remaining 40% of shifting). No matter what your inventory level is, the bottleneck is much more likely to be downstream in this lopsided example. Hence, unfortunately, the hypothesis that the bottleneck direction is linearly related to the inventory is not true!
What does this mean?
In sum, you can use the inventory levels to find the bottleneck best for systems with similar cycle times. It does not work very well for systems with very different cycle times.
This is a bit of a bummer. Finding the bottleneck through the inventory is just so very convenient. Luckily there is a way out. You see, if one process is a stronger bottleneck than the others, then most of the time the inventory method will still show towards this strong bottleneck.
Take for example the lopsided graph from above. This graph shows you the likelihood of the direction, but not how often an inventory level actually happened. In fact, it took quite a long simulation to get even a few inventory levels of 0 and 1. Most of the time the inventory level was between 8 and 10.
Hence, you can still find the bottleneck using the inventory levels, you just should not rely on only one observation! Now go out, look at your inventories, find your bottleneck, and Organize your Industry!
Sources:
- Romeser, Carolin: “Richtung des Engpasses in Abhängigkeit vom Füllstand eines Bestandes”, Master Thesis Karlsruhe University of Applied Sciences, October 6th 2015.
- Romeser, Carolin., Roser, Christoph. Direction of the Bottleneck in Dependence on Inventory Levels, in: Proceedings of the International Conference on the Advances in Production Management System. Presented at the International Conference on the Advances in Production Management System, Iguassu Falls, Brazil, 2016.
Hello, Your definition of bottleneck lacks one more point – it does not shift. Otherwise what you have is an unstable system.
Hi Vilius, in my experience real world systems are always dynamic, and the bottleneck shifts. I have seen fast paced systems with few buffers where the bottleneck moved in average every 5 minutes. Assuming a static bottleneck is in my experience highly unrealistic.
Hello Villian, Maybe the bottleneck does not shift if you have ” a stable system ” which means stable cycle times and stable queue time and stable demand from market too. For example, Like my company the bottleneck do shifting because very different variable cycle times.
Regards,
Agus
Hello, Christoph, Agus
are we talking about a conveyor type of production? You and I have some misunderstanding of what we both call a bottleneck, Beecause I have seen systems with tens of work centers and hundreds of SKUs, and they were stable – bottleneck did not move for months. Market in those cases was very volatile, but bottleneck was stable. Proper buffers in right places usually stabilise the system.
Hi, Even when bottlenecks must be machines, I noticed people become bottlenecks and as a leader we have to balance the line, because there are too many combinations of operators due to absenteeism.
Hi Omar, usually when “people” become the bottleneck, it is not the person, but the work assigned to that person is too much. Be very very careful before you call a person the bottleneck, as often it is the work assigned and the person will be quite upset for the (potentially unfair) accusation of being a bottleneck!