
 Knowing the symbols for value stream mapping is only a first step. This is like the difference between knowing the alphabet and writing good stories. There are much more things to consider for generating a good value stream. In this post I will go through the basics of drawing value stream maps. I found it surprising how much detail there is to what in literature is often simply abbreviated to “go out and draw it.”
Visualization
Posts about visualization in lean manufacturing. Actually seeing things (rather than just getting some data sheets) is a key part of lean manufacturing.
Overview of Value Stream Mapping Symbols
Value stream maps are usually drawn using standardized symbols…or that is what most people believe. While there are some symbols that are used pretty much universally, other elements have different symbols in different organizations or by different sources. Other identical symbols are used in a different way by different organizations. And, every day people seem to invent new symbols. In this post I will (try to) give an overview of what is out there, along with my opinion on what I use frequently and what I usually avoid.
When to Do Value Stream Maps (and When Not!)

Value stream mapping is a method to create a structured image of the material and information flow on the shop floor. You often hear that a value stream map should be the first and last thing to do during a lean project. It sometimes sounds like all you need is VSM and Kaizen and you are on the road to success. This is bollocks! While value stream mapping is sometimes quite useful, it is not a universal tool.
Bubble Diagrams to Visualize Material Flow

One of the many different ways to visualize a value stream on paper is a bubble diagram. While not quite as prominent as value stream mapping, it does help you in the design of a new line. Bubble diagrams are used in many different contexts, but here I will explain their use for lean manufacturing.
Visualize Your System – Overview of Diagrams in Manufacturing
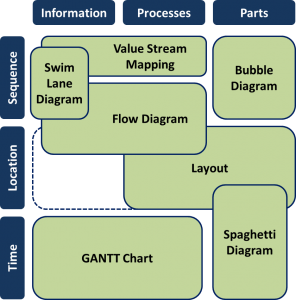 Organizing your manufacturing system is one of the keys to success in manufacturing. There are different tools available, although I have the feeling they are often mashed together or confused. Time for a structured overview of the different manufacturing diagrams available, with recommendations. The following post does not give a full explanation on how these visualizations work. Instead, I want to give you a summary of what is out there, so you can pick the right tool to improve your system.
How 5S Works

5S is one of the basic methods in lean manufacturing, used to create and maintain a clean and organized work environment. As far as lean methods go, it looks pretty easy. After all, everybody has cleaned something at least once. Unfortunately, cleaning it once is not enough. The challenge is to keep it clean! And this is where most 5S activities fail. In this post I want to describe the basics of 5S and how it works (plus also 4S, 6S, and even more S’s). In my next post I want to point out the hidden dangers of failure, and give some advice on how to make 5S stick.
Visual Management during World War II – A Visit to the Lascaris War Rooms in Malta
 For larger improvement projects with a dedicated project team, there is frequently a “war room,” a conference room where all the project-related information and performance measures are kept. The name sounds cool and gives a certain air of focus to the project.
The name, however, comes from war rooms for real wars. Recently I had the chance to visit the Lascaris War Rooms in Malta, where I was able to see many tools and practices that are still common nowadays in manufacturing and project management.