
 To improve your system capacity, it is a must to find and improve your bottleneck. However, finding the bottleneck is difficult. Most methods used in industry fail at finding the bottleneck. As discussed in my previous post on Shifting Bottlenecks, this is mostly due to bottlenecks being dynamic and frequently shifting from one process to the next. In this post we will look at common bottleneck detection methods used in industry. More importantly, we will find out more about failures of bottleneck detection methods commonly used in industry. Subsequent posts look at bottleneck detection methods that actually DO work!
Shifting Bottleneck Reference System
To demonstrate the reason for the failure of pretty much all commonly used bottleneck detection methods, I will use a simple system as an example and reference system. The system has only three processes (P1, P2, and P3) and four buffers of limited capacity. For easier understanding, the system will be a static system (see Shifting Bottlenecks) – except that the static cycle times change halfway through the observed time. The buffers are assumed to be small enough so that they run empty or full quickly during the two phases of the observation.
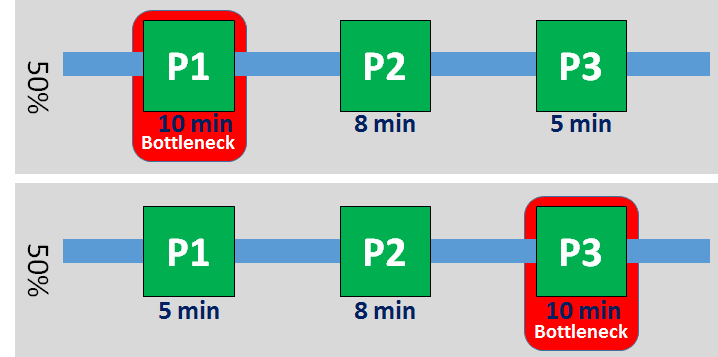
The system is visualized below. For the first half, process P1 is the clear bottleneck with a cycle time of ten minutes per part. After half the time the system is running, cycle times change. The cycle time of process P1 is reduced to 5 minutes, and the cycle time of process P3 is increased from five to ten minutes. Hence, the bottleneck shifts from process P1 to process P3.
We defined the bottleneck as follows:
The bottleneck in a system for any given time is the process that constrains the system capacity at this time.
For the first half of the time, system capacity will only change if there is a change in the cycle time of P1. Hence, the bottleneck is at process P1 for the first half of the time. Similarly, for the second half of the time, the bottleneck is at process P3. Please note: Process P2 is never the bottleneck!
As for the reason for the change in system behavior – it doesn’t really matter. In reality it may have been a change in the product produced, a bug in the software, a failure of the operator, or a minor defect in the machine that changed the behavior. In reality you may also have larger buffers, Nevertheless, while the effect usually won’t be as drastic as in the example above, real production systems frequently have shifting bottlenecks that lead to the effect above. Also, please remember that the example above was selected for ease of understanding.
For practical purposes, we assume furthermore that the total time the system is running is long enough that the transition of the bottleneck from P1 to P3 is almost instantaneous compared to the observed time. Using this example system above, we now will test the most commonly used industrial bottleneck detection methods.
Average Cycle Time
In industry, probably the most popular method used to find the bottleneck is to look at the cycle times. The idea is that the process with the longest cycle time is also the bottleneck. Unfortunately, this does not work for shifting bottlenecks or changing cycle times.
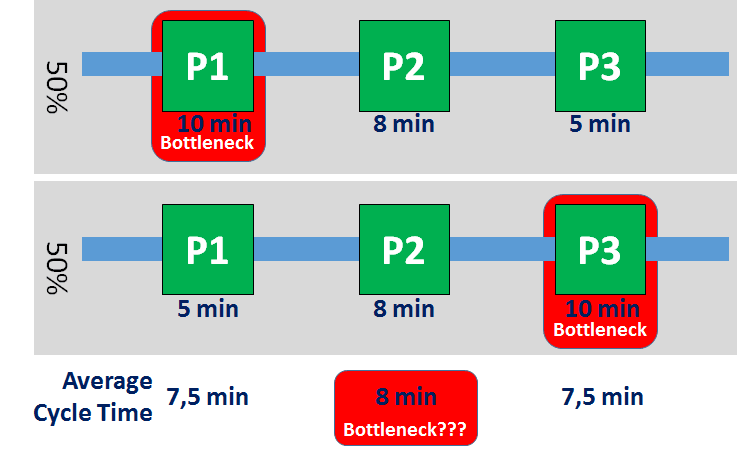
Let’s look at our reference system below. Process P1 has a cycle time of ten minutes and five minutes for half of the observed period, and hence an average cycle time of 7.5 minutes. Similarly, process P3 also has an average cycle time of 7.5 minutes. Process P2 never changes and has an average cycle time of 8 minutes. According to the bottleneck detection method using average cycle times, process P2 must be the bottleneck – except that in reality it never was. The average cycle time method finds the bottleneck in a process that never ever was the bottleneck!
Okay, you could argue that you would have to use the average cycle time method twice for different systems. However, please remember that the system above was created so the behavior can be easily understood. In reality, there will not be such a sharp distinction between two subsystems, but rather an ever-changing real system. Nevertheless, the flaws of the average cycle time method still apply to real systems. In summary, bottleneck detection using average cycle times does not work!
OEE or Utilization
A variant of the method using cycle times is the method using the Overall Equipment Effectiveness (OEE) or Utilization (for details on OEE, see my series of posts on measuring and fudging the OEE). Here, the utilization or OEE is used to find the bottleneck. The idea is again that the process with the highest OEE or utilization is the bottleneck.
Again, let’s look at our reference system below. For half of the time, Process P1 has an OEE of 100% and P3 of 50%. For the second half, these OEEs change. Process P2 always has a constant OEE of 80%. Since there is a part leaving the system every ten minutes constrained by the bottleneck, Process P2 has to wait two minutes and work eight minutes out of ten minutes. Hence, Process P2 has an OEE of 80%.
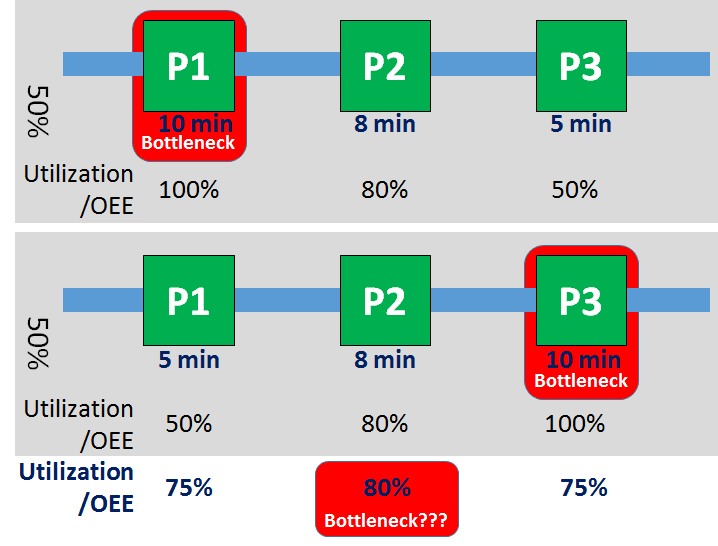
Now we average the OEE over our two subsystems. Process P1 and P3 will both have an average OEE of 75%, while process P2 has an OEE of 80%. Hence, according to the method process, P2 must be the bottleneck – except it never ever was the bottleneck in reality.The OEE method or utilization method finds the bottleneck in a process that never ever was the bottleneck!
For reference, bottleneck detection using OEE can be slightly modified by including additional losses in the OEE, including speed losses, quality losses, and availability losses (See What is OEE?). Only waiting times for parts or transport (starving or blocking) should not be included in this modified OEE method. Nevertheless, the results would be the same and this change merely fine-tunes a fundamentally flawed method. In summary, bottleneck detection using OEE or utilization does not work!
Average Inventory Levels
Another commonly used method for bottleneck detection is through inventory levels. The idea is that a buffer that is rather full indicates a bottleneck downstream, whereas a buffer that is rather empty indicates a bottleneck upstream. This approach is valid as long as you don’t use averages. In fact, it is one of the two cornerstones of my own “bottleneck walk”; however, the approach falls apart as soon as we start to use averages.
Let’s look again at our reference system. For the first half, Process P1 is the bottleneck. All buffers before are full, all buffers afterward are empty (and we simplify here the occasional part passing through as still empty). Similarly, for the second half, Process P3 is the bottleneck; all buffers before are full, and all buffers afterward are empty. Again, for simplification reasons we assume that the bottleneck shift from P1 to P3 is rather quick compared to the overall time period.
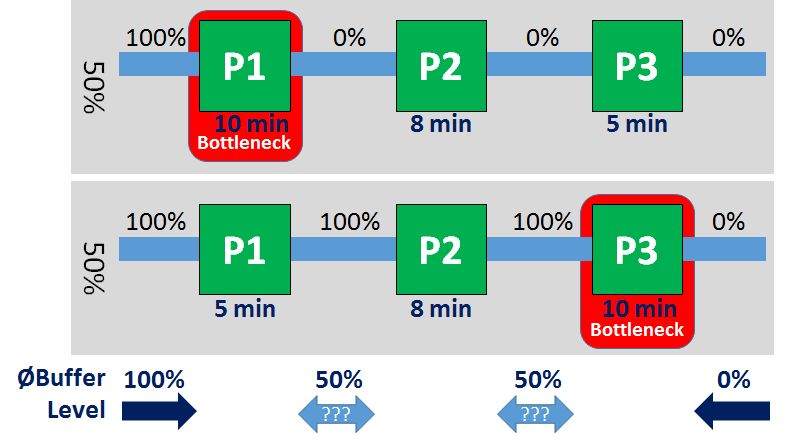
Taking the average, we will find that the first buffer is always full, indicating a bottleneck downstream. The last buffer is always empty, indicating a bottleneck upstream. So far so good. However, the two buffers in the middle are both 50% full, giving no clue as to where the bottleneck really is. Hence the method using average inventory levels does not find the bottleneck.
In reality there might be more random events, and an average of exactly 50% is rare. However, deciding which direction the bottleneck is, based on a 49% or 51% inventory level, is quite daring in my opinion. Furthermore, regardless of which direction the method picks, it misses out on one of the two bottlenecks in the system. In summary, bottleneck detection using average inventory levels does not work!
Average Percent Blocked or Starved
Finally, we look at bottleneck detection through the percentage of a process being blocked and starved. A process is blocked when the process cannot give its completed parts to the next buffer or process. A process is starved when the process is waiting for new parts to arrive. The idea is that a blocked process indicates a bottleneck downstream and a starved process indicates a bottleneck upstream. As for inventories, this approach does work and is the second cornerstone of my own “bottleneck walk.” However, as soon as you start to use averages the method breaks apart.
Let’s look again at our reference system. For the first half, process P1 is neither starved nor blocked, whereas processes P2 and P3 are starved for 20% and 50% respectively (i.e., waiting for two and five minutes out of ten). Similarly for the second half, processes P1 and P2 are blocked for 50% and 20% respectively. Again, for simplification reasons we assume that the bottleneck shift from P1 to P3 is rather quick compared to the overall time period.
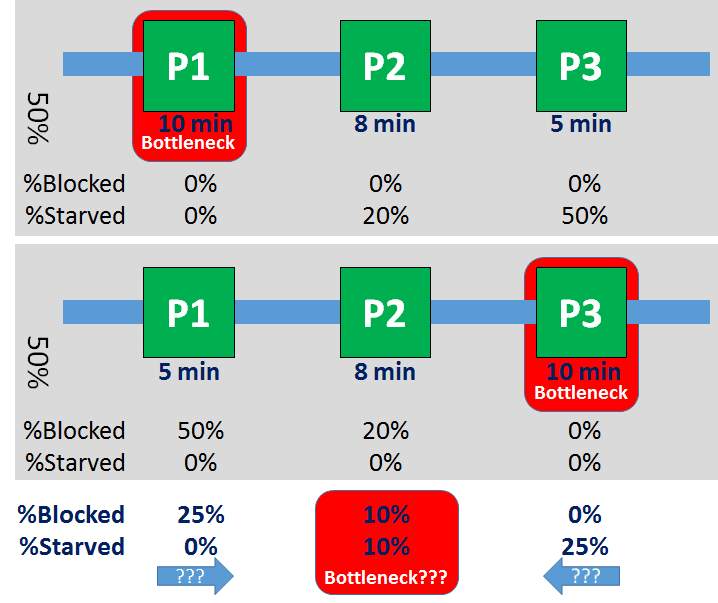
In average, Process P1 is blocked 25% and starved 0%, indicating a bottleneck downstream. Similarly, Process P3 is blocked 0% and starved 25% of the time, indicating a bottleneck upstream. Process P2 is each starved and blocked 10% of the time. Since processes P1 and P3 both point at process P2, and process P2 has the lowest percentage of being starved and blocked, the method could consider process P2 as the bottleneck – except that process P2 was never ever the bottleneck. Hence, the method using percentages blocked and starved does not find the bottleneck.
Again, in reality the results would be less clear. However, even if by chance the method would not find process P2 but one of the other processes, it would still miss half of the shifting bottlenecks. This also applies to fancier scientific approaches using average percentages blocked and starved as, for example, by Kuo et al 1996 (Kuo, Chih-Tsung, J. -T. Lim, and Semyon M. Meerkov. “Bottlenecks in Serial Production Lines: A System-Theoretic Approach.” Mathematical Problems in Engineering 2 (1996): 233–276.). In summary, bottleneck detection using percentages blocked and starved does not work!
Concluding Remarks
As seen above, pretty much all methods used in industry to find the bottleneck do not work in reality. As Toyota long ago found out:
"Never Ever Use Averages for Bottleneck Detection!"
Any bottleneck detection method using averages will go haywire with shifting bottlenecks. Since most people in industry use methods with averages, most people will have an opinion on bottleneck detection, but they are mostly wrong. As part of my work in industry on bottleneck detection, I usually ask the people of the plant beforehand where they think the bottleneck is. People are usually quite sure they know the bottleneck (both management and white- and blue-collar workers), but the detailed analysis proves most of them wrong. Between 50% and 75% of the people pick the wrong process as the bottleneck.
Even worse, since they do not reliably identify the bottleneck, they improve a process that has little or no influence on the overall system capacity. The time, energy, and money they put into improving a non-bottleneck will not yield any improvement of the overall system and, in summary, will be a total waste of effort.
In my subsequent posts I will show different methods to find the bottleneck reliably even for shifting systems. Best of all, my most favorite method – the “Bottleneck Walk” – does not even need any time measurements or mathematical calculations, but instead relies only on simple observations and an easy graphical analysis.
Other Posts in this Series on Bottlenecks
- Shifting Bottlenecks
- Common Bottleneck Detection Methods that do NOT work!
- Mathematically Accurate Bottleneck Detection 1 – The Average Active Period Method
- Mathematically Accurate Bottleneck Detection 2 – The Active Period Method – My preferred method if you have lots of data (e.g. from a simulation)
- The Bottleneck Walk – Practical Bottleneck Detection Part 1 – My preferred method on the shop floor
- The Bottleneck Walk – Practical Bottleneck Detection Part 2
See also
If you prefer an academic source for citation, use this:
Roser, Christoph, and Masaru Nakano. “A Quantitative Comparison of Bottleneck Detection Methods in Manufacturing Systems with Particular Consideration for Shifting Bottlenecks.” In Proceedings of the International Conference on the Advances in Production Management System. Tokyo, Japan, 2015.
Hello Christoph,
I am writing my masters thesis on bottleneck detection, I have a question on the active period method. Assuming you have a process that is your current bottleneck because of the longest active period, even though it is producing parts and not down. Couldnt it be possible that a second process that is down and not producing parts at all is more severe than the bottleneck that has a longer active period but is producing parts?
Thank you for helping me understand,
Sebastian
Hello Sebastian, the second process (that is down) would become the bottleneck once it starts to impact the other (former bottleneck that is working). This happens if the active period of the downed process is longer. When this happens depends mostly on the buffer (inventory or free spaces) in between.