
In my previous two posts, I described how to calculate the number of kanbans (Post 1 and Post 2). However, this calculation is complex, and the result is nothing more than a very rough estimate. Hence my preferred method for determining the number of kanbans is, broadly speaking, “just take enough, and then see if you can reduce them.” In this post, I would like to explain this approach and also discuss how and when to update the number of kanbans.
Simply Estimate the Number of Kanbans
When determining the number of kanbans, rather than going through the calculations, you could simply estimate the number of kanbans. For this you need a bit of experience, but it is doable. I also recommend not doing it alone; instead, do this as part of a group that includes a foreman or team leader from the affected shop floor.
Of course, this estimation is also not very precise. I usually go for a conservative number, where I believe I’ll definitely have enough kanbans. Having many parts instead of a few is better than missing deliveries or idling workers. But isn’t lean all about reducing material? Not all, but yes, it is one aspect of lean. Once your kanban system is up and running, of course you should verify if the number of kanbans fit the system.
Verify if the Number of Kanbans Fit the System and Adjust if Needed
How do you verify if the number of kanbans fit the system? Simple. You track your supermarket inventory. Ideally, you may have a distribution as shown below. The graph shows the inventory for one product type in your supermarket, which can vary between zero (stock out) and the maximum of all kanbans being in the supermarket. This graph below would be an ideal distribution. You never run out of stock, and since your supermarket is never full, you also never run out of work.

In reality, however, you may touch both the upper and the lower limit sometimes. Touching the upper limit is no problem. Especially if you work in larger batches, this may happen frequently. In this case your graph may look like the graph below.
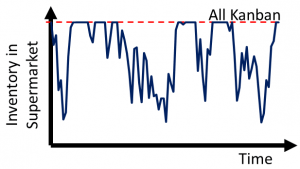
Occasionally, however, you may run out of stock. As shown in the example below, your system ran out of stock once during the observed period. Of course, more kanbans could have buffered you against this stock-out, but you have to decide if this is worth the additional kanbans. If it happens very infrequently, you may decide to live with it rather than increasing your inventory.

On the other hand, if your graph looks like the graph below, then you have serious problems with your kanban system. Assuming that your system is not the bottleneck but could deliver the demand, the situation below is a sign of not enough kanbans. But by the time you get that graph, both your customer and your boss have probably already told you that they are not happy with your system.
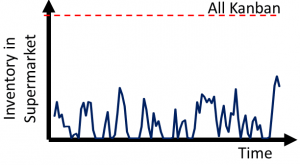
Finally, there is also the possibility of a graph as shown below. You always have a good inventory, and often all your kanbans are in the supermarket. In this case you may have too many kanbans. Consider removing a few kanbans out of the system to get closer to the first or second picture above. The number of kanbans you could remove altogether is the distance between the lowest inventory and zero (i.e., in the example below, about half of the kanbans are not needed). Of course, my advice would be to start slowly and remove maybe 25% of the kanbans rather than half of them. Then continue to observe and, if needed, remove more.

Through this observation of supermarket inventories, you can adjust your number of kanbans by observing your real system with real data, avoiding all those rough estimates in the kanban formula. Naturally, even if you used the kanban formula, it is advisable to verify the results through your inventory levels. If you constantly run out of stock despite your kanban calculation, then you do not have enough kanbans, regardless of what the calculation said.
Overall, a normally functioning kanban system has – very roughly – about half of the kanbans with parts in the supermarket; the other half is waiting for processing or being processed. Of course, the larger your batches, the higher your average inventory level (since you need more kanbans for the batches).
Check Occasionally or Seasonally
Production systems are constantly changing. The number of kanbans that work today may be insufficient or too much two months later. After establishing the kanban system, you need to keep an eye on it. If the customer or the system changes, you may need to update the number of kanbans. One common example is seasonality. During the season, you may need more kanbans than during the off season. In this case, add kanbans at the start of the season and remove them afterwards.
I hope this post was helpful for you. Please let me know if you have any feedback or questions. Otherwise, go out and improve your industry!
Dear,
we normally use this kind of formula:
Number of Kanban = Daily Demand * Lead Time * (1 + Safety Stock) / Container Quantity
You can find some solved exercise here:
http://www.leanlab.name/kanban-calculation-a4-solved-exercises
Dear LeanLabStaff,
Your formula works, too, as most kanban formulas use a similar approach. I personally like to look at the fluctuations of both the system and the customer in more detail, while in your case this is included in the safety stock percentage (I hope 😉 )
Thanks for commenting,
Chris
Can you elaborate a little more on your statement below?
“Of course, the larger your batches, the higher your average inventory level (since you need more kanbans for the batches).” – This is in the 3rd from the last paragraph in bold font.
Was this regarding the number of parts per kanban, multi-card kanban vs. single card kanban (i.e., 2-bin system), or both?
I am running a single-card (2-bin system), and I am considering changing it to a multi-card system (e.g., 1 kanban card = 1 bin). I think this will reduce the average inventory level, but I wanted to see if you agree.
Thank you.
Hi Eric,
It basically means that a lot size of one has in average less inventory than a larger lot size, since larger lot sizes create an uneven flow of material.
As for your 2 card system: If you add more cards with the same number of parts per card, you will naturally increase your inventory. To reduce inventory you would have to make the number of parts per card smaller. Since you use a 2 bin system (one card per bin), you probably cannot really reduce the number of cards. However, you could continue with 2 bins, and have less parts per bin or a smaller bin.
Hope this helps.
Best wishes,
Chris
Now we have created this Kanban Calculator On Line. I hope could be useful for some simulations.
http://www.leanlab.name/kanbancalculatoronline/kanban-calculator-online
We look at a parts shipping history (6 months) and calculate 3 factors to see if it is suitable for Kanban.
1) Is demand stable? Stability = (one standard deviation of the demand / the average weekly demand) x 100%. If stability is 60% then pass this test.
3)Is demand above a certain Qty per week on average? If above min level for that item, pass this test.
For a part to be suitable for Kanban, it must pass all 3 tests.
This is a fast way to sort out suitability for Kanban using maths & data in place of opinion.
Hi leanlab2014,
I found the model that you made for kanban calculator very interesting,it helps me so much on my graduation project,my project is to set up a kanban system,I just want to make some modification on Excel but I couldn’t,they asked me to enter a password.could you please share the password with me?
??? There is no excel in my post! I am also not the author of the LeanLab document, and don’t have their passwords.