
Maybach Cost Structure Estimate
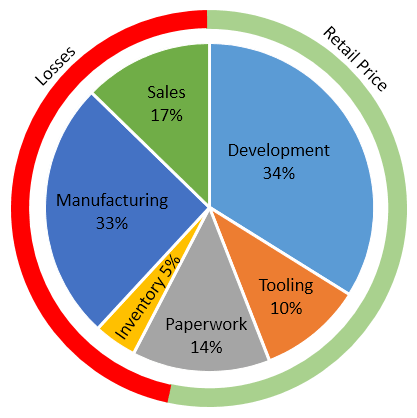
Estimate of the Maybach cost structure based on publicly available data and expert estimates. Graph shows the different elements of the total expense for an average Maybach vehicle over its lifetime (1997 to 2013). The outer circle shows the average sales price and the gap towards the total cost (the losses). All values are estimates and by no means official numbers from Daimler. This image by me is licensed under the Creative Commons Attribution-Share Alike 4.0 International license. Please credit the image as shown below. For digital documents and web pages please do include the links as shown below. Thank you.
By Christoph Roser at AllAboutLean.com under the free CC-BY-SA 4.0 license.
- File Name: Maybach-Cost-Structure.png
- File type: png
- File size: 12.87 KB
- Dimensions: 417 x 418
- Date: March 13, 2014
- SEO Title: Maybach Cost Structure Estimate
- SEO Description: Estimate of the Maybach cost structure based on publicly available data and expert estimates. Graph shows the different elements of the total expense for an average Maybach vehicle over its lifetime (1997 to 2013). The outer circle shows the average sales price and the gap towards the total cost (the losses). All values are estimates and by no means official numbers from Daimler.
- SEO Keywords: maybach, daimler, cost structure
- Post or page attached: A Lean Obituary for Maybach – A Cautionary Tale About Cost of Complexity,