

This is the second post on how to measure the cycle time of a process. Again, the cycle time is the fastest repeatable time in which you can produce one part. Hence, as part of a series on manufacturing speed measurements I continue with more details on what cycle times really are. This is the second post on how to measure cycle times (post 1 here), with an additional third post focusing on the details of manual cycle times coming up next.
Some sound Advice
A Warning on the Sequence
In the previous post I described one approach to measure the cycle time by taking multiple measurements of the time between parts, where you measure the time between the completion of one part until the completion of the next part for multiple parts. For this, however, you have to keep an eye on the sequence of operations.
If you measure the cycle time of an automatic process, the system will (most likely) repeat the steps of the process always in the same order. However, if the process includes manual work, then often operators self-optimize their work by fiddling with the sequence.
The operator could do the sequence differently for different cycles. In this case, if you measure cycle to cycle the measurement may be off. Similarly, I have seen many instances where the operator makes semi-batches by doing one step of the process multiple times in quick succession, and then does the other steps in their normal sequence.
The image below shows a simple process, consisting of three steps A, B, and C. We assume that in this process, the sequence can be mixed up (e.g. you have to screw three screws, and the sequence is not important for the final part). The cycle time is measured always from the beginning of step A to the beginning of the next step A.
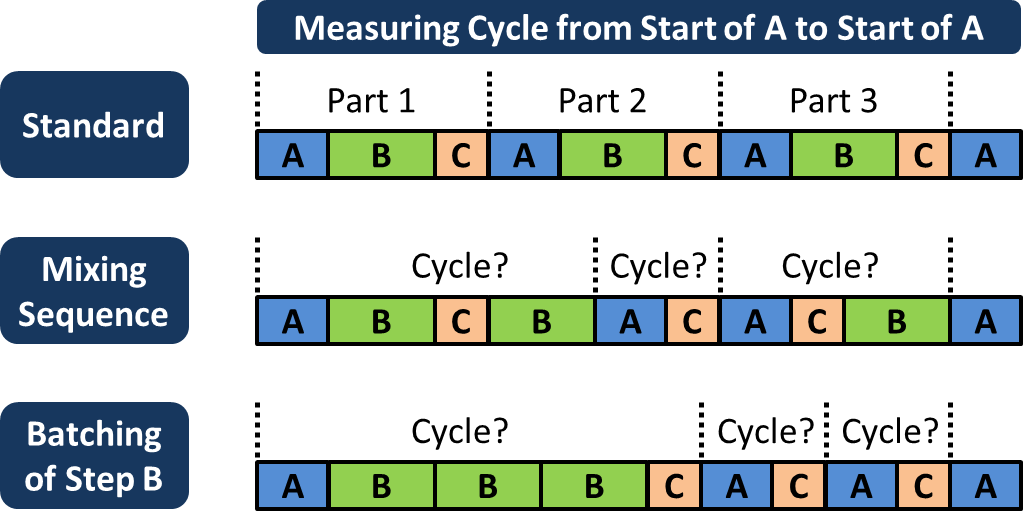
If the standard sequence is strictly followed, all cycles take the same time, as shown in the first row. However, if the sequence is mixed up, suddenly the cycle time starts to fluctuate heavily despite the same overall time for three parts, as shown in the second row. Same is true if the operator starts batching by doing three steps B in sequence before doing the rest, as shown in the final row.
Despite all steps itself taking the same time, the cycle measured varies significantly if the sequence is not standardized. Your cycle times will fluctuate much more, and make it harder for you to determine what your cycle time really is. Hence, when measuring cycle times make sure the same sequence is followed for all measurements!
What to include in the Cycle Time?
Many processes have a mixture of both cyclical work (needed for every part) and non-cyclical work (needed only every few parts). Examples for no-cyclical work are loading a new box of parts, setting up the machine, or exchanging a worn tool. Naturally, the cycle time should be measured only on the cyclical steps. However, if you take the median or a lower percentile, any cycles that include non-cyclical work resulting in longer cycles are automatically excluded from the resulting cycle time.
A Note on Part Type Variations
 Naturally, not all parts have the same cycle time on the same process. A more complex part may take longer for milling than a simple part. In a perfect world, you would measure the cycle time of every possible part type at every possible process. Using the number of parts for every type you can now generate weighted averages to determine the average speed of your line.
In reality, you probably lack the time to measure every part. Focus on the high runners, and think about where you need accuracy, and where you can get away with less. While I sometimes hear the general requirement that you must measure everything with absolute precision, in practice you may often hot have the time. Try to be as precise as necessary, but don’t waste time on precision that is lost anyway in a later calculation (especially if you calculate the number of kanban!).
Some Statistics – which you probably don’t need in Practice
Which Distributions are Common?
Below I will talk a bit about random distributions. Fortunately, you usually don’t need to know the exact distribution, unless you really want to use the data for simulations. But first, what type of distributions could you expect for cycle times?
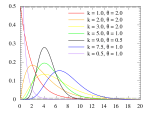
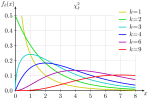
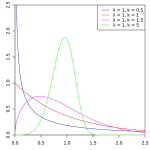
Generally, a random distribution for a cycle time should be continuous and have a range that goes from a non-negative number to infinity. I.e. the cycle time cannot be lower than a certain value, most definitely not less than zero. That rules out for example the normal distribution (or Gaussian distribution). Secondly, the distribution is usually not symmetric but very one-sided towards the lower end. Heavy tails are common (more below).
The following distributions are well suited for cycle times, possibly with an additional offset on the x-axis. Naturally, more distributions are possible.
- Exponential distribution
- Pareto distribution
- Lognormal distribution
- Gamma Distribution
- Chi-Square Distribution
- Weibull Distribution
On the Precision of Cycle Times
As described in the previous post, the cycle time may differ quite significantly depending on what percentile you use as the cycle time based on multiple measurements. Due to outliers, you should definitely not use the mean. It is better to use the median, the first quartile, or the 10th percentile.
Of course, depending on which method you use or which percentile you calculate, the cycle time may look quite different. This is unfortunately often the reality due to small (and sometimes large) random events forming the underlying random distribution.
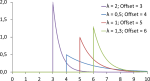
The image below shows different percentiles for a standard exponential distribution with λ = 1. Depending on which percentile you take, the resulting cycle time could be quite different.
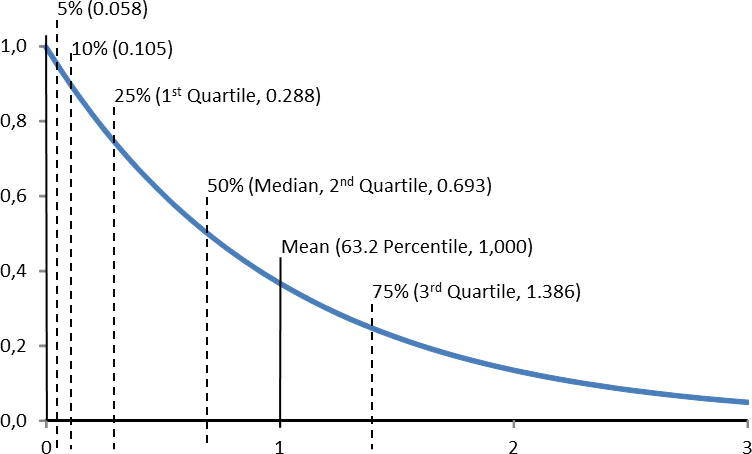
Importantly, more measurements won’t bring these numbers closer together! You are not reducing the standard deviation, but are merely measuring the distribution more precisely.
On Heavy Tails
 Most cycle time distributions are very one sided (meaning most measurements are towards the lower end of the range), but also fat-tailed or heavy-tailed (meaning there are usually rare but comparatively long times between the parts, e.g. if there is a break down and the system stops for minutes or hours).
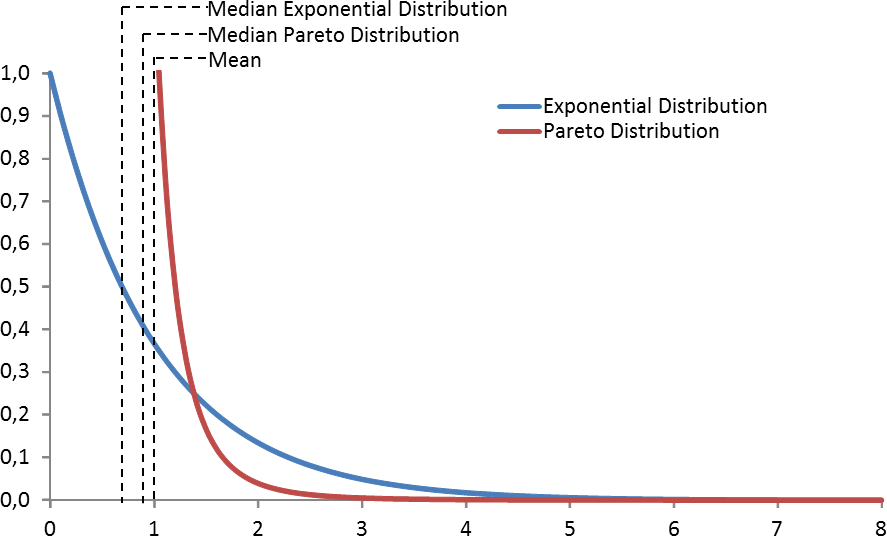
The graph below shows the probability density function of both a exponential distribution, and a much more heavy tailed Pareto distribution that have the same mean. The Pareto distribution has a much higher probability of very small values (visible in the diagram below) and very large values (too small and too far to the right to be seen in the diagram below). Only between 1.4 and 12.4 is the exponential probability higher. Both have the same mean of 1, but the median of the exponential distribution is only 0.693, whereas the median of the Pareto distribution is 0.892
Some highly automated processes have a quite narrow distribution. If the computer takes 3 seconds to inject, 25 seconds to cool, and 5 seconds to eject an injection molded part, the cycle time will mostly be very close to 33 seconds. Hence, the cycle time will differ only by a small percentage regardless if you use the 10th, percentile, 1st quartile, or the median. Other processes that have a wider distribution will have significant differences depending on which approach you use.
Summary
Cycle times (and other time measurements) are not a precise science, in practice it is usually only something that is (hopefully) good enough. So, if you are looking for the one true way to get the right cycle time – sorry, there is no such thing! I usually base it on the median or 1st quartile of a data set, or on available data with a brief verification. In any case, make sure it is measured as a time per part (and not its inverse), and please do not mix it up with takt times, which includes all losses and other delays.
I hope this post helps you to determine the speed of your system, and to match your supply with your customers demand. Now go out and organize your Industry!