
 One of the necessary tasks in becoming leaner and improving your industry is to eliminate waste. I like to use a simple approach for measuring waste in manual work to know how good (or bad) the current situation is. To explain my approach I commissioned a few animations. Let me proudly present my approach and my animations, so you can also estimate the efficiency of manual lines when you are on the shop floor.
Introduction
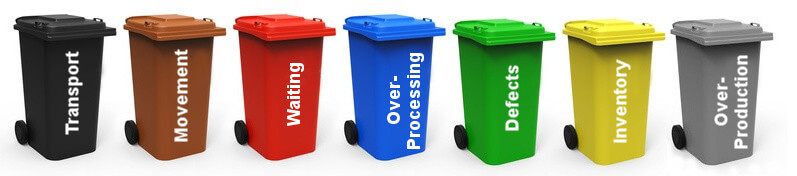
You are all familiar with the lean concept of waste (muda) as part of the trinity of waste, overburden, and unevenness (muda, mura, muri). You probably know the seven types of waste (although some count eight types or more). Sometimes there is a distinction between avoidable waste (e.g., defects, which should be eliminated) and unavoidable waste (e.g., transport, which should be reduced, but it is hard to produce anything with zero transport).
The Trickiness of Distinguishing Waste from Value Add
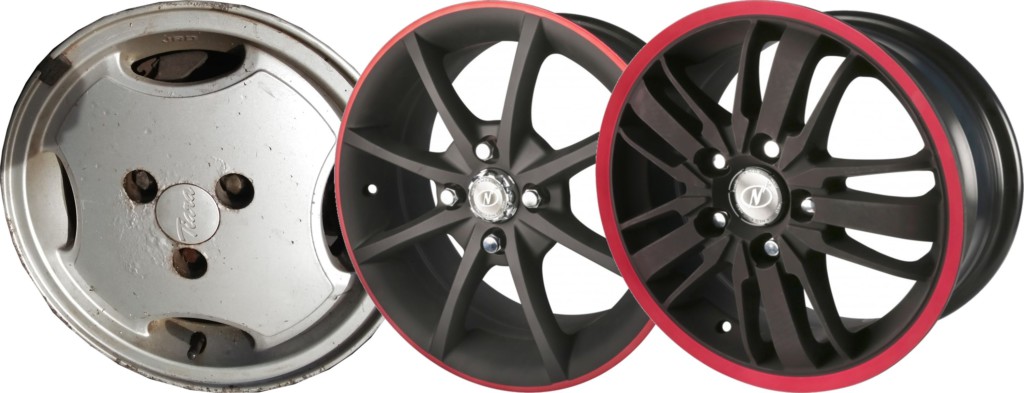
Waste is sometimes also contrasted with value add, which is anything that creates value for the customer. Either your people are creating value for the customer or they are not. This sounds simple in theory, but in reality it is sometimes hard to distinguish waste and value add. For example, if you build cars, you need to attach wheels to the cars. The value for the customer is that the car has wheels. Transporting the wheel around is of no value to the customer. Attaching it to the rest of the car is. But then, is the value in screwing in the screws, or merely in tightening them the last quarter turn. Would all those excess turns of the screw be a waste? Can you do it with even less screws? Or could you skip an entire tire?

Even more extreme, if you are a retail or logistics company, you do add value for the customer by providing products to them. But in conventional lean wisdom, all transport and inventory is waste, but clearly the customer is paying for the service.
Overall, you have to think about what your company does that adds value to the customer. At the same time, do not think too hard about it, because then you would start questioning everything. While this is okay in principle, it also has to be practical. If your boss wants you to reduce waste related to attaching wheels to cars, you probably should not suggest flying cars or anti-gravity transportation…
It becomes even more difficult if you do not know the products or process very well – for example, if you are only a visitor to a plant. However, in this case I use a rough estimation to measure the efficiency in manual operations. Let me explain:
Observing Value Add and Waste
I use a simplification to decide if something is waste or value add, and then use a quick-and-dirty estimation to measure what percentage of the time a worker adds value. My simplifications for processes that I am unfamiliar with is that whenever the worker touches the part, it is value add. For example, if the worker adds components to the main part (e.g., during assembly) or removes stuff (e.g., during machining), it is probably (hopefully) value add. Nevertheless, use common sense. If the worker is touching the part but it is obvious that it is waste, then it is waste. Similarly, if the worker is not touching the main part, but nevertheless you believe this to be value add, then it is value add. But for most observations, this “touch-no touch” distinction is good enough for an estimate.
The images below show an example from my animation. In the background you will see a sign that tells you if it is value add or if it is waste, and which type of waste it is. In reality, of course, you do not have such a sign, but for training purposes it helps immensely.

Again, this is a simplification! It is easy to imagine situations where the worker touches the main part, but only to fix a problem or because a component does not fit well. Hence, this method is not perfect and tends to overestimate the value add slightly. On the other hand, you can use this approach even if you are unfamiliar with the process, or if you can observe it only from some distance. Both are common for visitors and tours. So now you can estimate when a worker is adding value and when not.
Measuring Value Add and Waste
This gives the next step: you can count how often you see a worker adding value and how often not. If I see a worker, I wait briefly to understand what he is doing before determining if it is value add or not. Usually, I use a three-second delay. In my head, I count to three, and on “three” I determine if the action at “three” is value add or waste. You can even count the same person repeatedly at different times. To do the actual measurement, I simply count instances of observing value add and instances of observing waste. This counting is a simple list of dashes as shown below.

This brings me to my animation below. This animation is admittedly quite wasteful, but in my next post I will have two more animations with improvements. Look at the animation loop and count to three. At “three,” is the stick figure adding value or doing waste? The sign in the back helps you in this training animation, but of course in reality there would be no such sign. Hence, focus on the person, and after three seconds decide if it is value add or waste. Try to really focus on the timing at “three.” If the worker just added value, but turned around at “three,” then it is no longer adding value. If the worker walked a long distance, but at “three” just started touching the part, then it is adding value, even if he wasted a lot of time beforehand. Count every time you see a value add or a waste at this “three” spot in time.
Now you have a random sample of a few observations, always deciding if it is value add or waste. Of course, more is better. Using these numbers we now can calculate the percentage of the time a worker is adding value (number of observations of value adding divided by total number of observations) or waste (number of observations of waste divided by total number of observations – or simply the remainder to 100%). And, voila, you now know the percentage value add of the manual labor at this line or station.
If you do this measurement for the animation above, then you will get the percentage value add. I did the calculation for you, and it is a measly 17.4% value adding time, with the remaining 82.6% of the time being wasted (24.4% movement waste, 22.2% waiting waste, and 36.2% transport waste). Depending on how many measures you took, you should get numbers somewhere on this magnitude.
 These counts can easily be done on the fly during a plant visit, and it may take less than ten minutes to observe a line. If I do it in reality I may have a total of ten to forty observations. You can measure them for the entire plant overall, or separately for different lines or cells.
Keep in mind it is a rough estimate. However, I definitely prefer my own rough estimate over any “official” value add numbers I get, which are most likely “optimized” to look good. I don’t believe 120% value add just like I don’t believe 115% OEEs, and I have seen them a lot 🙁 . In my next post I will show you what values to expect, and also two more very similar but more efficient animations. Now, go out, measure your efficiency, and organize your industry!
I love what you say, but would point out that “every three seconds” is not random (although it is perfectly functional in your example). Technically it is stratified sampling with a random starting point (and variation based on counting speed).
I point this out because Randomness supports many powerful statistical tools as an assumption but is not met in this case.
Hello Brent, I phrased it incorrectly (and since fixed it). You are right that a three second interval is not truly random, and hence not a random sampling. But what I meant is that when you decide to sample, watch the operator for three seconds before deciding if that moment is value add or waste. The three seconds delay is in my view necessary to understand a bit of the operation and it really helps to decide if it is value add or not.
This is a bit more random. However, truly random sampling is difficult, going down a rabbit hole with pseudo-random number generators and alternatives (I have been there briefly, and decided to get out of that hole fast). Thanks for commenting 🙂
I like the 3 sec rule; I will try to practice it in my next Gemba walk. Thank you very much.
Thanks for the article Christoph. It has also been my experience that people have quoted absurdly high PCE and OEE with some rather dubious acceptance of what counts as value added activities. I ‘believe’ this is due to some senior managers not ‘liking’ low numbers and therefore setting unachievable metrics. Apart from education, do you have any tips on how to get ‘honest’ measures accepted and communicated?
Hi Jonathan, thanks for the comment. I also occasionally come across OEE’s of 115% or so. Tricks to inflate the OEE are so common that I even wrote a sarcastic guide on how to inflate the OEE: Top Three Methods on how to Fudge Your OEE 🙂
Christoph, I like a lot the type of “cartoons” you use to explain the concepts.
On the other hand, about how to specify if there is any waste or value added, a large number of observations or cycles, I think is required.
Hi Alejandro, more observations is higher quality data, but I have done such observations with as low as 15 measurements, and rarely go above 40 measurements for a single line. For the underlying accuracy of the observation itself, I think this is good enough.
Hello, I am pretty new to the LEAN way of thinking and commenting on blog.
I believe this article did a great job illustrating, the 80% 20% rule. Using the simple estimation method you referred to in this blog gives some great insight into waste verses value added. Using just 3 second observations and simple arthritic I could confidently estimate “on the fly”.
Looking forward to reading the feature blog post and see what these animations are up to.
Hi, I loved your article. I am currently enrolled in a Six Sigma Green Belt course and it is great to refresh my mind o. the thinking style of lean six sigma. A thought that occurred was potentially expanding the belt so that the worker did not need to travel as far, another that a machine could be placed in the center position and place the triangular top on to the square bottom. I find it fascinating that movement, waiting and transport are waste. What would be considered an efficient percentage for a worker to be wasting value at? Moreover in the past have you seen a correlation in the value added to a product and the effort/enthusiasm a worker has? Thank you for the great article!
Hi Cristian, there are lots of options. See also my next post on this topic. Thanks for commenting 🙂
Hi christop,
Nice article with clear illustrations.
It was good refresher. Also,The “3 sec” rule will be good attention grabber for the mentee. Making the coaching process simpler.
Can’t agree more on the OEE part. I think that’s because,Most of the organisation limit it to a mere reporting kpi. rather than using it as a driver for continuous improvement.
Looking forward to your next article.
Hello, I really enjoyed your article on waste and how it can be measured. I never thought about the total waste times when looking into a simple repeated task. This is the first time I have heard of the “3 Second Rule”. I used to work for a company on a line and when looking at the way you describe waste Would say the value added by me and many employees was very low as we did little to benefit the product itself. What is OEE’s? I agreed that having something above 100% is questionable.
Many thanks to all for the comments. The three seconds is just an aide to count value add/waste. If you see a person, you need some time to find out what he is actually doing, and for me three seconds delay is often a good time to catch the flow of the task. It can be more or less, depending on the complexity of the task and your familiarity with it. But it is a very useful tool for estimating waste in manual work 🙂
Hey Christoph! I thought this article was awesome; I’m a very visual learner so seeing the moving diagrams was very helpful. I have to ask – in which ways have you been able to/seen IRL ways to reduce “waste” around a factory floor? Moving machines closer, increasing output, etc. It may seem obvious but often times (as you know) even a two second reduction in walking time from one machine to the next will add up significantly in the long run. Thanks!
Many thanks, Rhiannon. My next post has the same animations but optimized (note: Not perfect, merely better than this one!) The smallest improvement had was reducing 0.5 seconds from a process, but that process had a cycle time of 2.5 seconds, meaning I had a 20% improvement 🙂