
 In my last post I described a quick-and-dirty approach to estimate the percentage of value add (i.e., the efficiency) of manual work. While the value is only an estimate, it is a measurement that you can take quickly and easily even in passing for a manual workplace. You simply count when a person is adding value and when not (i.e., waste). This post will look into more detail on what numbers to expect, and what to do next if you want to increase this percentage of value adding time. Let’s have a look:
What Values to Expect
Having measured the percentage of value add as per my last post, what percentage of the time do you want your employees to be adding value? This is simple. The true north of value adding is 100%. Unfortunately, you will never reach 100%, and it is a constant struggle to even stay somewhere near it (unless, of course, you fudge your numbers).
So what values can you expect? I did this analysis for plenty of automotive plants in Japan, including Toyota. The graph below shows an overview. You can see that the best plants approach 80%. In average, Nissan was the best-performing company with around 70% value adding time across two plants, although the Takaoka and Tsutsumi final assembly line easily outperformed it with 75–80% value add. (For more on these plants, see my Grand Tour of Japanese Automotive.)
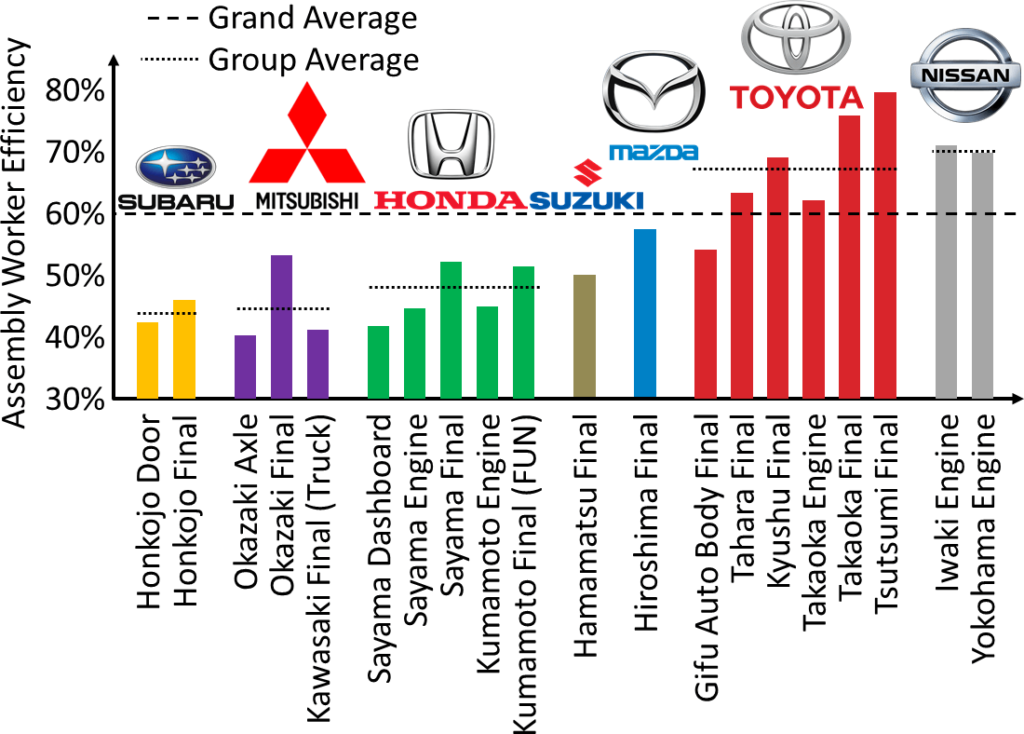
Hence, the benchmark is probably a percentage of value add of around 80%. However, you cannot measure all plants on the same scale. A high percentage of value add is easiest when you have a highly repetitive task with short cycle times and very similar products. Automotive final assembly lines usually fall under that category.
 The graph above, however, also includes some other vehicle lines. The final assembly line at Mitsubishi Kawasaki has a value add of only 40%. However, this line does not produce passenger cars, but instead trucks. The cycle time is much higher, the product variety and the work content varies much more, there are more instances where multiple workers have to work together for heavy parts, and overall it would be much more difficult to reach the same percentage value add. My guess is that a top-of-the-line truck assembly line may have a 60% value add. Similarly, Honda Kumamoto is also not passenger cars, but motor bikes. Here, too, you find more variety, although the cycle time is comparable to passenger cars. Benchmark here would be for me around 70% value add.
The graph above shows not only final assembly lines, but also subassembly lines (e.g., engines, axles, doors, and dashboards). These have often similar complexity and cycle times as the final assembly line, but the percentage value add is usually much less than the corresponding final assembly line. The difference is not the product or the speed, but management attention. The closer the manufacturing is to the final product, the more focus the line will receive from management. Often, final assembly lines are much more optimized than subassembly lines … and to a degree this is justified since the final assembly line has (usually) a much larger impact on the bottom line than the subassembly line. If you could improve the efficiency of your final assembly line or your subassembly line by 10%, which one would it be? Often, it is the final assembly line. However, I would not adjust my expectations down juts because management decided to look elsewhere.
These examples here are still all highly standardized products with a fast takt time. At the other end, you will find extremely customized products with extremely slow takt times, as for example machine tools (takt time 8 hours) or shipbuilding (takt time in months). In this case, even an efficiency of 50% would be quite good. Or you surely have seen construction sites where many more workers are standing around or generally doing waste instead of actually adding value.
 Expecting from a machine tool maker the same 80% value add as from an automotive assembly line would be unfair to the machine tool builder. Even if they could optimize their production process to 80% value add, the optimization may cost much more than the benefit of the value adding time. The best-of-bench comparison depends heavily on the product type and the assembly line.
This leaves the question: Which target is right for you? That is easy: If it is a problem, then the target is always better than what it is currently. If it is not a problem, then put your focus on the areas that are a problem. (This also works for other targets, too. 😉 )
Becoming More Efficient
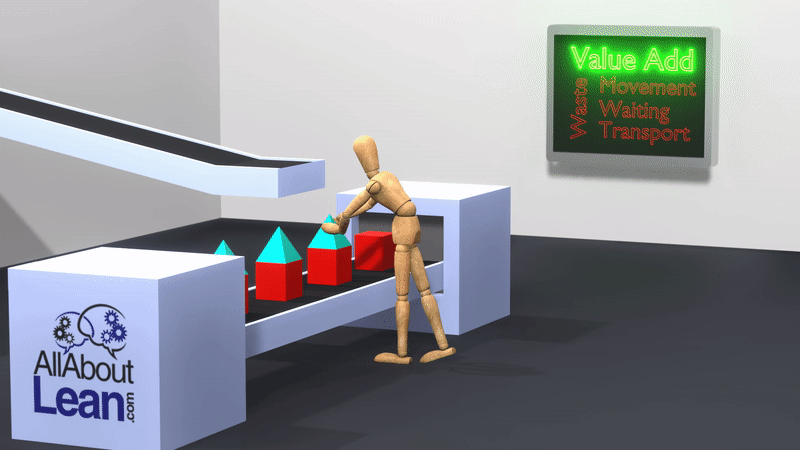
Becoming more efficient means to increase your percentage of value add, which means to reduce waste. In my last post, I presented a short animation loop of an assembly process with plenty of waste, and only 17.4% value add. Here it is again:
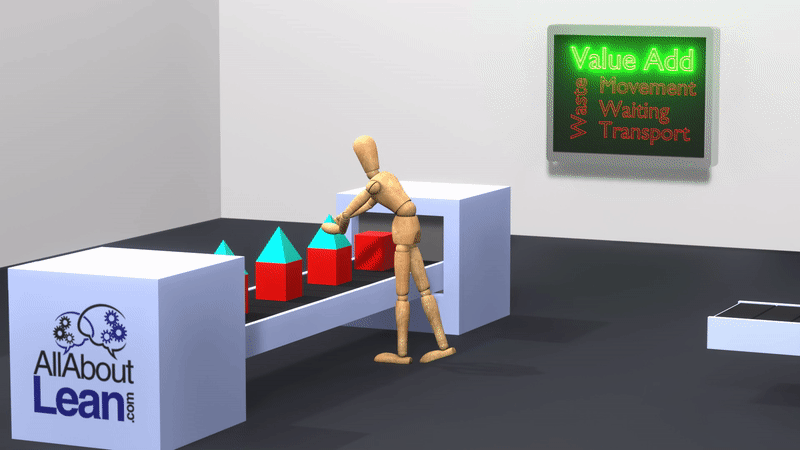
Here is a very similar animation, but this time the waiting time is eliminated. Have a look at the animation, and see or even measure how much less waste there is. I also did the measurement, and this animation above has only 20.9% value add, with a whopping 79.1% waste (35.6% movement waste and 43.6 transport waste). Still, it is better than the animation in the last blog post.

Finally, the last of three animations, where the waste is reduced even more. The parts are now much closer to the assembly line. The worker does not need to turn around or walk, but merely grabs the next roof from the subassembly line above. This reduces waste (of course assuming that you repeat the task often enough to justify the effort of installation of an overhead conveyor). You can count the value add in these animations yourself, and calculate the percentage of value add. Here, too, I did the measurement of the percentage value add. This animation is much better, with 44.8% value add. The remaining 55.2% of waste are 19.0% movement waste and 36.2% transport waste. If you measure it yourself, you should get similar numbers. Still, quite a bit away from Toyota with up to 80% value adding time.
Overall, it is quite possible to measure and understand waste and value add quickly for manual work in manufacturing. This is the first step in improving your system and becoming more efficient. I hope this approach helps you in also understanding and improving your own production. Now, go out, understand the waste, reduce it, and organize your industry!
As an NMUK alumnus I’m pleased to see Nissan’s ranking. Another perspective though: how much value would be added if a Rolls Royce ‘Spirit of Ecstasy’ were fitted to a Nissan?!!
Hello Steve, I think the Rolls Royce sells by NOT being mass produced. But then, I am not the target group for a Rolls Royce ‘Spirit of Ecstasy’ 🙂
Back to basics. Pure industrial engineering.
I think the TAKT TIME is the 1st reference to determine the percentage of Value Add it.
Right after, any continuous improvement action reducing TAKT TiME (major output) will be a direct result of incremental added value.
Thanks.
Hi Alejandro, Takt is important, but it is not the only thing (sometimes you have work that is hard to use with a takt). Besides, the line takt is merely the outcome of the work content and hence also the elimination of waste. Reducing takt could also be simply putting twice as many people there with half the work each, hence a reduced takt, but not an improved efficiency.
Hello Christoph,
I read the first blog in this series and was looking forward to this second blog. It seems to me that adding value with Manual labor is difficult. Even in the example presented by your animations. The conveyor belt certain helped the ratio but there is still the Waste in Movement and Transport. Imagining an optimized system is difficult with such a simply animation. However, what if the conveyor belt height was optimized for least amount of movement by an average sized worker? This could speed up the movement time and transport time. Ideally the conveyor belt and parts conveyor belt would be at the perfect speed a pyramid is presented and the time a new cube is presented.
I appreciated your take on final assembly and the importance of subassembly’s for optimizing the Average efficiencies.
Thank you !
Hello Justin, you can always optimize more to increase the value add. It also depends on how you define value add (where you will find no end if you go increasingly strict). The imitation is often the capacity to improve and change the process. If you have 100 manual processes, you can easily spend years on each of them to optimize them towards perfection. But, you dont have 100x years of manpower to optimize, hence at one point you have to stop. This method here can help you to determine where to put in your effort for the best impact 🙂
Excellent article. We are in the process of initiating a review of idle time so this speaks directly to that.
Dear Doctor ,
This is Liu Jun(john) from China and I`m reading your book ‘ All about Pull production ‘ recently and I got a question here regarding to KanBan calculation in Chapter 5.4.2.4.2 , the ‘waiting time in production queue .
the question is : if the Fist batch I produced is the red car, then from My understanding the red car waiting time is 0 ,only the following batches ( Blue and Yellow )have a waiting time .
thanks and looking forward to your feedback 🙂
Hello Liu, If the first batch in the queue is red cars, it gets produced next and has no waiting time. The question is: How long did this batch wait in the queue for production until it got to the first spot.
Or, if the kanban card for this card comes back, how long does it have to wait to move from the last spot in the queue to the first? This is really hard to figure out exactly, hence the “quick and dirty” estimate as described.
I think it’s fascinating that anything that is directly correlated to moving a process forward is defined as value, and anything that is not is waste by default. Initially, a worker crossing an aisle to grab a necessary component to the finished product may seem as though it is valuable, however, technically speaking, it is not. The productivity not necessarily equaling value aspect is extremely interesting, and I appreciate that you added the charts at the beginning to indicate just how “efficient” some of the world’s leading car manufacturers really are. It is also worthy to note that while machines may not make as many specific errors as humans (after all, it is impossible to avoid 100% human error), if the human overall works faster than the machine, then which one is more valuable to have on hand? Of course, an individual analysis would be needed in this case. Thanks for sharing!