
 In my last post I looked at the behavior of the supermarket inventory for different kanban systems. In this post I will use this information to estimate how much the material availability of a system changes if you increase or decrease the inventory limit of your pull system (i.e., number of kanban).
Parts of this blog post are loosely based on chapter 13.2 of my new book All About Pull Production: Designing, Implementing, and Maintaining Kanban, CONWIP, and other Pull Systems in Lean Production.
Estimating the Delivery Performance using the Supermarket Inventory
Relevant for understanding the performance of a kanban system is an understanding of the supermarket behavior. This behavior is best seen in a histogram. If the supermarket histogram never goes empty, your delivery performance is 100% … and you may even have too many kanban. The image below shows the histograms of three different systems that had a perfect 100% delivery performance, and the supermarket was never empty.

Depending on the duration of the replenishment time in relation to the cycle time, the histograms still look very different. A very fast replenishment time had usually most parts waiting in the supermarket. A much longer replenishment time of 100 cycles usually had only one-third of the parts in the supermarket. Nevertheless, the supermarket never ran empty.
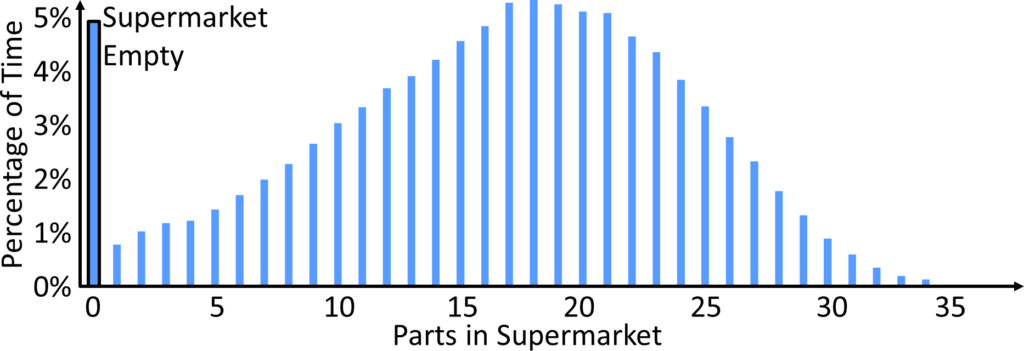
An example histogram of a supermarket that DID run empty is shown below. Relevant for the performance is how often the supermarket is empty. In the example below, the supermarket was empty for 4.95% of the time. The delivery performance was 95.02%, meaning that 95.02% of the customers did not have to wait for their part. This correlates very closely with the percentage that the supermarket was NOT empty of 100% – 4.95% = 95.05%
This estimate of the delivery performance on the percentage that the supermarket is NOT empty will be the basis for understanding the effect of changing the number of kanban. But first, let’s check more carefully. Below is the delivery performance (black line) and the estimated delivery performance (dashed red line) of a kanban system with different number of kanban. The lines overlap almost perfectly. Just to show how small the difference is, the second graph below shows the actual error (i.e., the delta between the actual delivery performance and the estimated delivery performance based on the percentage of the supermarket being NOT empty). This error is very small.


Of course, these are simulations. In reality, you will have two effects that reduce this accuracy. First, we try to predict future behavior based on historic data… which has the risk that the future may be somewhat different than the past. Your future system behavior both in demand and supply may be slightly different from in the past, meaning your past predicted delivery performance may be different from the actual future delivery performance, since the actual delivery performance has changed.
Second, you don’t just sit idle and watch your supermarket run empty. You take action and try to prevent this! Hence, the closer your supermarket gets to empty, the more likely you (or someone else) will be trying to prevent this from happening. However, even with those two uncertainties, the percentage of the time a supermarket is empty (or not) is a good estimator for the delivery performance.
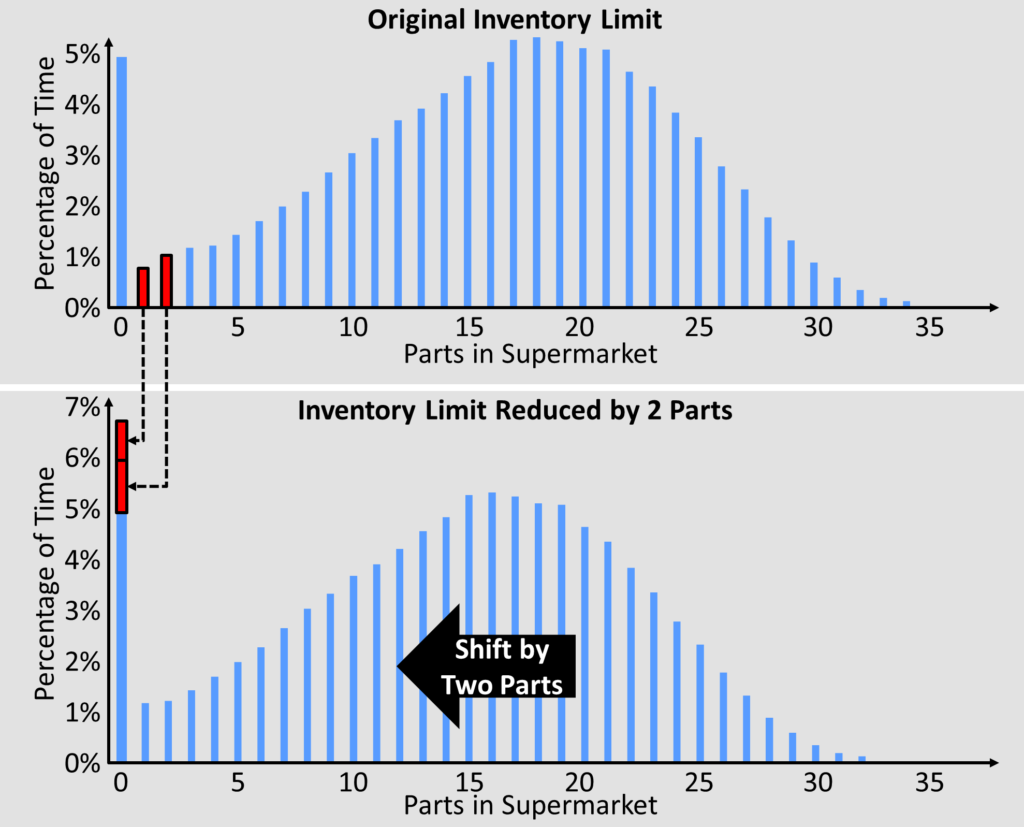
Reducing the Number of Kanban
The easier part of the prediction is reducing the number of kanban. The image below shows what happens if you reduce the inventory limit by two pieces, or reduce number of kanban by two if one kanban represents one piece. We add the percentage of the time that the supermarket had exactly one or two parts to the percentage of the time that the supermarket was empty. In this example, the predicted percentage of the time that the supermarket is empty is now 4.95% + 0.79% + 1.02% = 6.76%. This in turn predicts a delivery performance of 100% – 6.76% = 93.24%. The actual measured delivery performance was almost identical of 93.21%.
Increasing the Number of Kanban
However, reducing the number of kanban makes the delivery performance worse, and usually plants want it the other way around. The more common question on shop floors is “How many kanban do I have to add to achieve a delivery performance of x%?” This can also be estimated with the supermarket histogram, but it is mathematically not quite as easy. You would have to estimate how the histogram would continue if you move it away from zero parts. You could use mathematical curve fitting, which is exciting but not easy. An easier and practically still good enough approach is to simply eyeball the curve. This is shown in the example below.
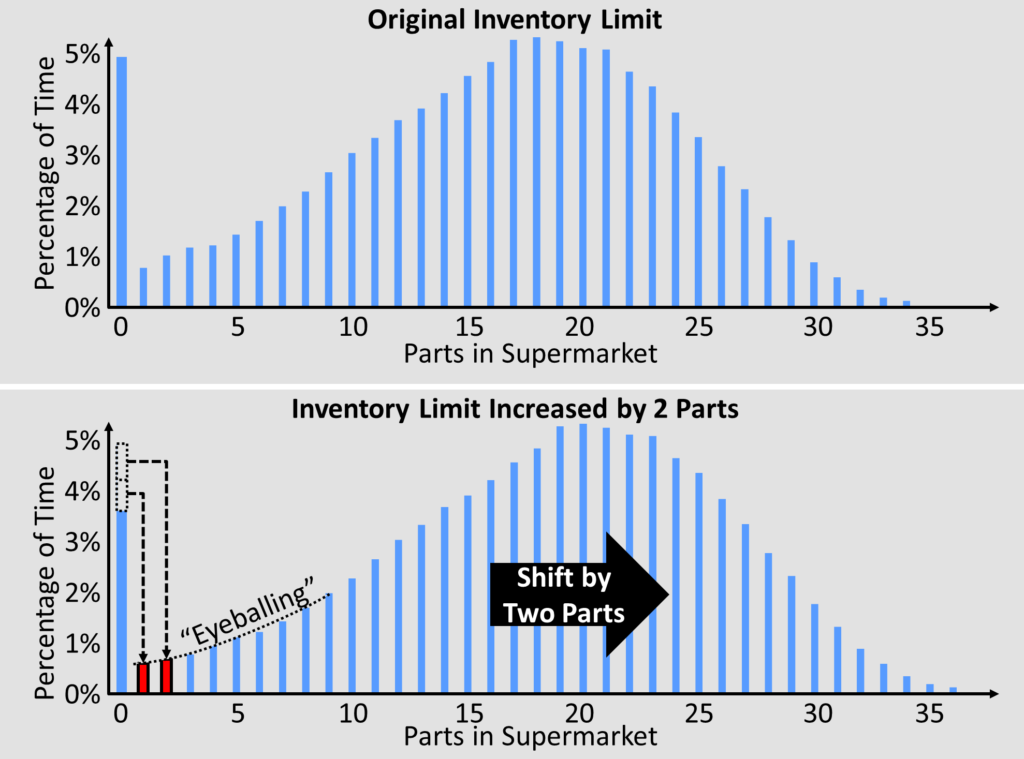
The number of kanban was increased by two. I eyeballed that, with two more parts, there will be exactly two parts in the supermarket for 0.7% of the time, and exactly one part for 0.65% of the time, with everything else being shifted two parts to the right. Hence, with two more parts 0.7% + 0.65% = 1.35% of the additional time, the supermarket will no longer be empty. This reduces the percentage of the time the supermarket is empty from 4.95% to roughly 3.6%. This would correspond to a delivery performance of 100 – 3.6% = 96.4%. The actual simulated delivery performance was 96.46%, which again is very close.
Summary
Overall, the histogram of the supermarket tells you not only how your kanban system performs, but also how it will probably perform if you increase or decrease the inventory limit (i.e., increase or decrease the number of kanban). Like all such estimations, the bigger your change is, the more your prediction will be off. Hence, check again after you change the inventory limit or the number of kanban if the system performs as expected, and adjust if necessary. Now, go out, take a close look at your supermarket, see if you need to adjust the number of kanban, and organize your industry!
Source
This blog post is based on my latest book on pull production, where you will find many more details on all of these systems and how they can work together. You will also find a foreword by John Shook.
Roser, Christoph. All About Pull Production: Designing, Implementing, and Maintaining Kanban, CONWIP, and other Pull Systems in Lean Production. 441 pages: AllAboutLean.com Publishing 2021.
This is a supply chain management article that highlights about how kanban system performs, also how it will probably perform if increase or decrease the inventory limit. This is an analytical and informative article that is very helpful. Hope this kind of article will be published more. Found this article while browse the internet.
Hi Sayeed, glad you liked my writing. For more, check out my list of all posts or my books
Hey Christoph,
I am excited to say I think my group has a clear idea of our Green Belt project. We are looking at one specific Cell that is underproducing weekly. This cell manufacturing inventory for a kanban system. Almost weekly the Kanban reserve is depleted before replenishment is completed. We are going to look at possible adjustment of reserves or overflow manufacturing cell to increase production.
I found it interesting that when you take away some Kanban’s that the affect is so great on the overall percentage of throughput. The histograms did a great job of showing this with “eyeballing”
Thank you