
 Knowing the symbols for value stream mapping is only a first step. This is like the difference between knowing the alphabet and writing good stories. There are much more things to consider for generating a good value stream. In this post I will go through the basics of drawing value stream maps. I found it surprising how much detail there is to what in literature is often simply abbreviated to “go out and draw it.”
Why Do I Need a Value Stream Map?
The first step in drawing a value stream map is to think why you need it. Depending on the reason, you may have a completely different map at the end. Also, consider alternatives to value stream mapping that may be more beneficial to your particular problem (see my post on Overview of Diagrams). Depending on your problem you may also find out that you do not need a value stream map at all. The tool has to fit the problem you want to solve. If you have no problem, you don’t need a value stream map. (See also my post When to Do Value Stream Maps.)
Preparations
If you know why you need a value stream map, there are a couple of things you should think of before you put the pen on the paper. Two of the most significant aspects are to define the area where you want to do the value stream and which level of detail you need. This may sound cliche, but it should be neither too wide nor too detailed. I have seen too many value stream maps with so much detail that they were never used because they were too complex.
The value stream mapping bible Learning to See describes four levels where a value stream is possible: within a single process or line, within a plant, across multiple plants within a company, or across multiple companies. But, please, don’t make them all! Focus on your problem, not on your value stream maps.
You may also narrow it down to a certain product or product group. This again depends on the problem you are trying to tackle. If you want to generally improve the flow within a line, it may be helpful to look at some of the major products. If you want to improve the flow for a certain product, naturally look at this product.
Depending on the problem you are trying to solve, you may have a team of people involved. Hopefully some people from the shop floor, maybe some management or some technicians. In any case, the team that does the improvement project is also the one that should be doing the value stream together. For me, the “value” of a value stream is doing the value stream map, not having one. You and your team learn most from drawing the value stream. If, on the other hand, one person of the team does the value stream alone and then presents it to the others, nothing is learned by the others.
Hence, involve the group unless you are a team of one. This is also fine. I have drawn many value streams simply for myself to understand the situation. Yet, if you want other people to use a value stream, they should be involved in making it!
The Basic Concepts
Material Flow

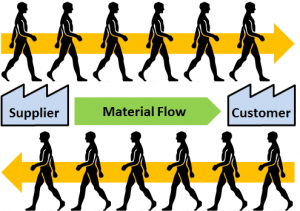
The material flow is the flow of parts through your manufacturing system. On a value stream map, by convention the material flows primarily from the left to the right. Hence your supplier(s) is at the left and your customer(s) at the right of the map.
Material flows can split and merge. For example, in an assembly process, many material flows merge. These may be more than what you can draw reasonably on any sheet of paper. Focus on the flow of parts that is critical for your task at hand.
Information Flow

The information flow represents how the information travels on the shop floor. Basically, there are two types of information that can travel on the shop floor.
Information flow to the processes: The production processes need to know what to produce. Hence, an information flow has to go at least to the first process in the system. This information could be a production order or a kanban. Of course, all the other processes also need to know what to produce. If you use FiFo for your material flow, this also doubles as an information flow. Any process that is at the end of a FiFo does not need any other information.
Information flow from the processes: The control system (may) need information about the production system. Depending on how you control the system, you may need to gather data about the items produced or the items in the inventory. Hence, information flow also can go backward from the production to the production control. Some of this may be standardized, but in a not-yet-good production system this usually also involves lots of people going to the shop floor and looking at parts or asking people. The better your value stream is organized, the less go-and-see actions are needed.
Different Options for Drawing the Current State Value Stream Map
Following the lean principle of going to where the action is, you should draw value stream maps on the shop floor. Ideally you walk from the customer to the supplier, although in my view this doesn’t make a huge difference. The five main reasons for starting at the customer are, in my opinion, in order of priority. (See also my post on Value Stream Mapping – Why to Start at the Customer Side.)
- Mental weight to the customer
- New thinking through different view
- See the information flow in pull systems
- Understand branches in material flow
- Sound smart to impress people (which is a lame reason on its own)
As for actually drawing the value stream, I find myself using different approaches at different times.
1) Drawing the Complete Value Stream While Walking the Line End to End
You could go to the line and draw the value stream from scratch while walking along the line end to end. This is often the standard approach mentioned in literature (go to the line from customer to supplier and draw the value stream).
However, I often find myself overwhelmed with the mass of information that I have to take in at once. Keeping track of the material flow, the information flow, the data details, and all the juicy morsels of information about inconsistencies and waste is a huge task.
2) Draw Material Flow before You Go to the Line

Therefore, I have also done it slightly differently. If I know the line already, I start to draw the material flow beforehand and then go to the line. The material flow is (usually) more standardized and hence a bit easier to draw. I usually start with drawing the supplier, the customer, and the main process boxes. This helps me to keep the overview of my value stream.
The information flow, however, is usually much less structured. Hence I always draw this while walking along the line on the shop floor. Of course, I also check if my “idea” of the material flow is correct. If I find differences, I of course update my map accordingly.
While I prepare parts of the value stream at a desk, my gut feeling tells me that drawing a value stream while walking along the shop floor is the better approach. This is in line with Toyota’s philosophy of “goto gemba” and “genchi genbutsu.” Nevertheless, I sometimes do the processes and maybe part of the material flow beforehand. It helps me to sort out my thoughts better.
3) Walk Line to Draw Material Flow, Then Walk Again for Information Flow (and Again?)
What I probably feel most comfortable with is a combination of the above. I again first draw the material flow, and then the information flow, but I do both while walking along the line. This way I get the benefits of both approaches. I can focus more on the material flow, which I do first because it is usually easier. This gives me a framework for the second round where I look in more detail at the information flow.
Yet, in both rounds I get the benefit of observing directly at the shop floor. Hence, I draw not the idealized state it should be (a common pitfall), but the real state I observe. An additional benefit of this approach is that I see the line twice and can hence observe if there are different standards at different times (or, more precisely, the absence of a standard).
If necessary, I walk the line even more. For example, if you need data of the processes, I often collect this during a third walk along the line, and even a fourth iteration is possible. Again, this depends on the problem you want to solve. By the way, if you read Learning to See closely, they also suggest to do more than one walk (quick walk first, then detailed to gather more data).
How do you do it? Which method do you prefer? Looking forward for any comments!
A Note on Data…
 Sometimes I read that a value stream map is not complete without the data. I disagree. It depends on the problem you want to solve. Most of the maps I drew had little to no additional data on it, because I simply wanted to get a grasp of the flow and its organization. I added data only if I needed it, for example to calculate the number of kanban or the lead time.
To get the data, you have two options: look it up or measure it yourself (counting, taking times, etc.). Usually, doing it yourself takes longer but gives you higher quality data. You would be surprised by the vast amount of outdated, manipulated, or even simply wrong data in manufacturing (see also my series on Lies, Damned Lies, and KPI).
Similarly, you can draw a zigzag time line underneath the value stream that shows how long each process takes and how long the parts wait between each process. This can then be summarized to show the percentage of time a part is worked on and the percentage it is waiting. In Six Sigma, this is called a process cycle efficiency (PCE).

Unless you have a batch process like annealing or baking involved, the result will be something around 99.95% waiting and 0.05% working. If you need the number, do the calculations. However, I rarely needed this number, and if i need it then only to generate a sense of urgency and to demonstrate the effect of excess inventory. Most of the time I did not bother to add this line, since I had more important things to do. It is up to you if you want to do it.
The Future State

With value stream maps, it is also possible to draw a future state map. This is helpful if you want to change the organization or structure of the material and/or information flow. The basis for the future state is your current state map.
Unlike the current state, however, you and your team can draw the future state in a meeting room. Some people simply replace all push arrows and unstructured inventories with FiFos, supermarkets, and kanban loops. However, the hard part is to implement it. The value stream map is only a visualization. The actual improvement comes through the use of different tools. Again, focus on the problem at hand!
By its nature, the current state ends up messy. You will probably find lots of unstructured “go and see” actions or multiple conflicting signals. This can be also used as an effect to show others how messy the system really is. Even if you include only the more frequent information flows on a typical shop floor, management is usually surprised about the mess and the lack of structure.
In contrast, the future state is usually much cleaner and more organized. Of course it is! After all, it is a theoretical and idealized thought structure. This does not mean that its implementation will actually be as perfect as the plan makes it look. This depends on the quality of the implementation. For more on value stream mapping see also When to Do Value Stream Maps (and When Not!), Overview of Value Stream Mapping Symbols, and Practical Tips for Value Stream Mapping. So go out and make the reality as perfect as your plan showed it in your never-ending quest to organize your industry!
Christoph –
Excellent post. You explore a number of important concerns like: when do I need a map and where should I start?
Given the fact that my use of VSMs are always intended to be viewed by the senior leaders of a site, I always include the data boxes, but if users are just “spitballing” the process and trying to get a sense of what’s going on, then I’ll concede the data boxes aren’t needed.
I’m confident that VSMs can be used a variety of ways for a variety of reasons, but contend the primary use of the VSM is for senior leaders to determine where and when to use their finite Lean assets.
Like you, I always recommend they work backward from the customer to find the closest disruption to flow. The data boxes then tell us what kind of intervention is needed: Standard Work Kaizen? Setup Reduction Kaizen? Information flow Kaikaku? etc.
Here is what I liked most about your portrayal of the building of a VSM:
* It’s messy and experimental. I like that you recommend a lot of “Go and See” symbols on early versions, indicating that what you’ve posted is a “best guess needing further validation.”
* I like that you don’t lead readers to believe that they have to hit a home run on their first time at bat. You suggest that they can expect to create the VSM in iterations, gradually making it more and more complete.
* I like that you perform the calculation for “waiting vs. working” time. That’s usually a total shock to first time observers, and creates an excellent baseline for further improvements to the Value Stream.
In short, I found yours a high level, but very well thought through post. Thanks for sharing.
HI Robert, many thanks for the detailed praise 🙂 🙂 🙂
I usually dislike making VSM for senior leaders, because for them in many cases it is just a wallpaper that they want but do not use 🙁 Hence, making these wallpaper-VSM is sort of a waste. On the other hand, not doing it when they want it would also be a terrible waste on that persons career …
But then, I am sure your upper management is different 😉
Hi Christoph,thanks for your excellent post,
About the future VSM,How long time plane for future?
What’s the difference of VSM & VSD.
thanks!
Hi Kai, VSM is current state, VSD is future state. Generally, the VSD describes what you want to have after the improvement project is over. It is possible to have intermediary VSD’s or long term vision VSD’s, but judging from the problems companies have to even implement a simple VSD, I would usually try to stick away from too complex visions, and favor of actual improvement.
Nice Article
Dear Readers,
I have some video here on Value Stream Mapping that could be useful for you:
https://www.leanvlog.com/value-stream-mapping-lesson-1/
https://www.leanvlog.com/value-stream-mapping-lesson-2/