
 Manufacturing is one of the drivers of modern prosperity. Most manufactured goods become cheaper and cheaper over time, adjusted for inflation. Services, on the other hand, usually become more expensive over time. In this blog post I dive a bit deeper into these changes, using the USA consumer price index as an example.
A Bit on Inflation
 Over time, the things you purchase become more expensive. That is called inflation. A moderate inflation of a few percentage points is often seen as good. For example, the goal of the USA is around 2% inflation per year. Wages are expected to rise along with inflation to make up for the loss in purchasing power. The average wage in the US is indeed increasing faster than inflation, but this is in large part due to a few wealthy people becoming even wealthier. However, the lower-income wages rise much slower than they should, creating lots of social problems.
For some time, Japan had the opposite, a deflation, and this is seen as problematic. Unfortunately, many countries nowadays suffer from insufficient inflation.

On the other hand, hyperinflation is terrible, as it destroys people’s savings. Germany in 1923 had an inflation rate of 29,525% – per month! More recently, Venezuela had 80,000% per year in 2018, and Zimbabwe even more. The world record goes to Hungary, which in 1946 had an inflation rate of 13,000,000,000,000,000% – per month!
Consumer Price Index

Measuring inflation, however, is a bit tricky, and it leaves lots of room for number fudging. Inflation is measured by following the prices of different quantities of different goods in a typical scenario of expenses for an average consumer. This is often called a basket of goods. This includes purchased goods, services, and other expenses of everyday life. With taxes, however, it includes only sales taxes and taxes that occur during purchase. Other taxes are typically not included, since this would make the government look bad, and we don’t want that (and I am sure the government can give you a much better-sounding reason for doing this).
On the plus side, the price history for a wide range of goods is available for many countries. For the USA you can find these at the Bureau of Labor Statistics. In Germany it would be the Statistisches Bundesamt.
Price Changes of Selected Items
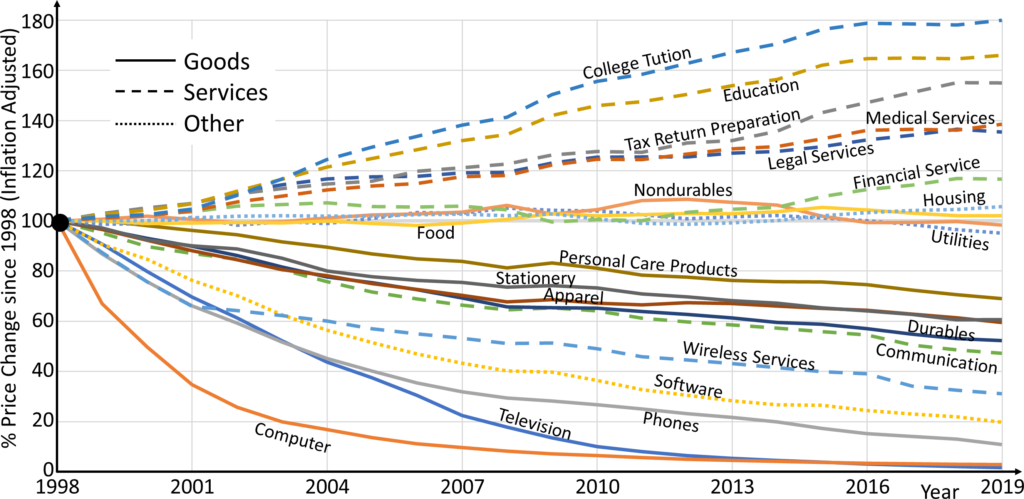
Hence, I had a detailed look at the data from the Bureau of Labor Statistics. The graph below shows the change of prices for different items since 1998, where 1998 is 100%. The graph is inflation adjusted, hence the average stays at 100%. The average price in dollars increased by 56%, but the graph is adjusted to eliminate the average price increase. If you are curious, my Excel raw data can be found here, including many more data points and many more years than what I have in my graph.
Change in Manufactured Goods
Since I am interested in the change of manufactured goods compared to non-manufactured goods, all physical goods in the graph have a solid line. All services have a dashed line, and the rest (utilities, housing, software) are a dotted line. Almost all physical goods have become significantly cheaper, some of them extremely so. TVs and computers are now dirt cheap, costing only around 3% of the 1998 price adjusted for inflation. Telephones are now only 14% of the 1998 price, also inflation adjusted. In general, durable goods (automobiles, appliances, books, furniture, etc.) cost only half of what they would have in 1998, again adjusted for inflation. The other large group of non-durables (also known as consumables), including its large subgroup of food items, kept roughly the same adjusted price compared to 1998.
Only few physical goods became more expensive, like tobacco and college textbooks. Tobacco now has higher taxes to improve overall health by smoking less. College textbooks is an organized scam where students are often forced to buy overpriced and expensive textbooks for the benefit of some professors, publishers, and universities. Side note: I use one of my own books for my own lectures, but this is priced at cost at the beginning of the semester for students. Nine euro for a 300-page book is not bad, I think. Still, some students complain that it is not free, but they become quiet after hearing that many US students pay $2,000 and more per semester for textbooks.
Change in Services and Other

It looks very different for services, which I have as dashed lines in the diagram above. Almost all services became significantly more expensive. Tuition almost doubled in price, even before inflation is added. Medical services and legal services became significantly more expensive. Pretty much the only service that became cheaper was communication, including wireless communication, and this was probably mostly due to cheaper computers. Other than that, there are few services that became cheaper (private transport and recreation was a tad cheaper).
Housing and utilities did not change much with inflation, but software also became cheaper, probably also influenced by cheaper computers.
The Big Picture
 In sum, manufactured goods are getting cheaper over time, while services are becoming more expensive. The data here is for the USA, but the trend is similar for most of the world. A few items may be different (healthcare and education in the US is particularly outrageously priced), but the big picture remains the same. Some items have a disparity in power between the seller and the buyer. It is hard to negotiate a price when you are on the operation table, and US healthcare particularly takes advantage of this. Prices are much lower in the rest of the world. I can buy an international travel insurance for one year for €700, valid worldwide excluding the USA and Canada. If I include the USA, the price more than doubles to €1650, because of the insane healthcare prices in the USA.
Why the Difference?
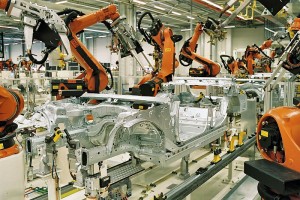
 The simple reason is that manufacturing becomes more and more automated. We replace human labor with machines, and also use different tools (including lean) to use both machines and labors efficiently. With mass production, we can make products insanely cheap. In one of my previous blog posts I was looking for the cheapest ballpoint pen, and nowadays you can make a ballpoint pen for USD 0.035. A decent pen can be found from USD 0.045. This is, at most, two minutes of human work per pen, including all development and machine building. All the rest is the work of machines and computers.
This trend is likely to continue in the future. In fact, even services may eventually be affected. With increasingly smarter computers, more and more service tasks could be automated. Already students are hesitant to pay big tuition for mere online courses (due to the COVID-19 pandemic). Many banks have noticed that they no longer need fancy brick-and-mortar buildings. And many consumers have noticed that they don’t need a fancy bank in the first place, resulting in a rise in cheaper fintech companies. Fintech stands for “financial technology,” and aims to use computer technology to provide banking and other services much cheaper than what would be possible conventionally. I myself am looking forward to this revolution.
While this post is not a typical post on hardcore lean tools and philosophies, I do hope that you enjoyed reading it, and that it gave you a bit more understanding of the big picture. Now, go out, reduce the cost and subsequently the prices of your products some more, and organize your industry!
I think one cost dynamic, at least in the US, which has driven down cost of physical products is the “outsourcing” of specific costs for producing. An example, if you look at the US meat industry (industrial farming), many of the costs burdens are shifted away from the producer. These costs include worker safety & healthcare & environmental impact costs, among others. Second example, is the cost of disposal of white goods (eg, refrigerators) and electronics. Your graph shows the steep decline of TV – yes, technology is a major contributor, but electronic waste is a not built into the price, but society is burden by. Europe leads the way in trying to incorporate these costs into the initial price of the physical item.
True, the end-to-end cost for society including the impact on the environment is not reflected by the price. However, this is also true for services. Data centers that provide you the internet use tons of energy. A taxi ride produces CO2. This will probably be a huge problem in the near future (wildfires anyone?)
I believe we are to blame for the US manufacturing decline. The U.S for more than three decades, has prioritized globalization while deprioritizing the strength and resiliency of its industrial base. This caused a major decline in US based manufacturing over the years and resulted in a decline in the economy. The U.S definitely needs to focus on reducing the cost and subsequently the prices of their goods if we want to compete with countries in Europe and revitalize the economy.
On the other hand, you have a lot of IT giants (google, amazon, apple, facebook, …) which we Europeans are quite jealous of. Although, manufacturing creates much more jobs for the same revenue…
Talked about the change in the manufactured goods section and it talks about the increase in prices of services and online information/databases, while almost all physical goods have seen a decrease in price in regards to inflation. I am wondering if it is just the physical products and finished goods that have seen a decrease in price like TV’s and computers, or did the raw materials to make these physical products also go down in value? proportional to the physical goods and inflation. Also with the decreasing rates of manufacturing in the USA as well as manufacturing jobs due to automation, is the constant growth of automation going to take all manufacturing jobs/distribution deliveries when autonomous trucks can be making deliveries 24/7? I know were are a little ways away from fully autonomous manufacturing and distribution, but it has already begun to take jobs not just from Americans but also in plants across the world, will autonomous innovation surpass human employment in manufacturing and distribution jobs.
Hi Dylan, I haven’t looked at raw materials (mining, farming, etc). I know oil prices are down, rare earths are up, iron ore is constant, etc. But this is an interesting question. I believe a lot of service will become cheaper as AI becomes better (especially logistics as you mentioned). Potentially most jobs can be automated in the long run, creating worries for the economists. An universal basic income may be a possible solution, although the transition period may be nasty.
A major challenge that affects the productivity and improvements of the manufacturing operations is the visibility happenings in the shop floor control to the top floor. As the operations are still conventional in most manufacturing companies, updating the machine, operator data to the existing ERP on a daily basis poses a huge challenge.