
There is quite a difference between knowing in theory how to measure an Overall Equipment Effectiveness (OEE), and actually measuring it in practice. This post will give crucial tips and points on how to measure the OEE on a real shop floor.
As is frequently the case on the shop floor, reliable and good data is rare. This is especially true in the calculation of the OEE since obtaining the required data is difficult. As a result, I usually do not trust any OEE numbers on the shop floor unless I know the calculations behind it. Most OEE numbers calculated are, in my opinion, of such low quality that they are not worth the effort. Hence, getting the data for an OEE is not quite that easy.
In the previous post, we looked at the definition of OEE, including losses of availability, speed, and quality. In this post, we will investigate how to measure OEE. Following posts will detail the top three measures how the OEE is frequently fudged, and what the OEE is good for and what it’s not.
Time Basis for OEE

The first question you have to answer is the time basis of your OEE calculation. Do you want to look at only the planned shifts, or do you want to consider round-the-clock twenty-four hours per day seven days per week?
In most cases in industry, the basis is the shift model. If the operation is scheduled to work two shifts five days per week, then the time basis are those two shifts for five days. However, if your system is short of capacity and unable to meet customer demand, then it may be suitable to start with a 24/7 time basis. Yet, be prepared for opposition from your people. A 24/7 time basis will make an OEE go down, so on paper it looks worse even though the system has not changed, only the calculation. As your people may be judged by the OEE, they may have an interest in looking good with a nice OEE number (and maybe even you too).
In any case, regardless of what your time basis is, you need to figure out what you could have produced in that time.
Speed Basis for OEE
The second important number you need is the speed of the machine. What could the machine produce if everything else around it is perfect? The shortcut approach is to take any number you may have on record. However, in my experience, these numbers are usually incorrect or outdated. They may be simply the average of a good day of production. However, even a good day of production has losses, and taking the average would ignore these losses. They may be based on a theoretical calculation, maybe using MTM or REFA methods, which are often much slower than a good worker and include estimates and personal breaks.
To get a good estimate of the maximum speed of a process is to repeatedly measure the time between the completion of parts. You will find that this time is statistically distributed (don’t worry, we won’t go into the statistical details here). Most times clustered around the average, some took longer, a few took much longer maybe due to a breakdown, and some were faster or much faster than the average. The goal is to get the shortest time possible. However, if you merely take the smallest value in your set of measurements, then you probably got a measurement error. It is better to sort the measurements and take the time where 95% or 90% of all measurements are slower than that time (statistically speaking, the 5th or 10th percentile).
The OEE Itself
Now you have the time basis and the speed basis. Dividing the time basis by the speed basis gives you the theoretical number of parts that could have been produced. For example, if you decided to analyze two 8-hour shifts per day for 5 days, you have a total of 80 hours or 4800 minutes. If your process has a maximum speed of one part every 2.5 minutes, then you divide 4800 minutes by 2.5 minutes per part and get 1920 parts that you could have produced in that time.
These theoretically possible 1920 parts are now compared with the actual production during that time. This number is usually easy to get, as even the worst plants have a rough idea of what they have produced. After all, the operator’s salary may depend on it.
In the above example, let’s say that you have produced not 1920 but only 1132 parts, then your OEE would be 1132/1920 or 59%. That’s it.
Of course, you may also be interested in the losses that caused you not to produce 788 parts during that week. Now it gets a bit more challenging to get reliable data.
Digital Data Monitoring

If you’re lucky, you may have a digital data monitoring system on your machine that makes an automatic protocol of what the machine does when. However, in my experience, even if there is a digital data monitoring system, it usually does not have enough data to calculate the losses reliably. For example, quality problems can only be detected afterward and will not be logged in the system. The process may not know if a stop was due to a missing operator or a missing machine. In all likelihood, with a digital data system you still have gaps and need to find out at least some details in a different way.
Manual Observation

Probably the gold standard in OEE measurements is manual observation over a longer period. In this observation, a separate worker is standing next to the machine to take a protocol of when the machine is doing what. He or she should write down any irregularity (e.g., when the machine stops, the operator is absent, material is missing, or products are scrapped). This will probably be the most reliable data you can get. However, this gold standard comes with a gold-plated price, as you need to pay for one operator round-the-clock to stand next to the machine to take a protocol.
If you nevertheless want to do this manual observation, here are a few practical tips:
- Prepare the data monitoring very carefully, possibly with some shorter test runs. It will do you no good to have three days’ worth of data that is missing crucial information.
- Include the unions and operators. Observing a machine alone should be no problem, but few machines are unattended. In effect, you are making a round-the-clock protocol of what the operator does and doesn’t do. Get the operators and unions involved so they understand what you are doing and why. Never do it against the will of the operators, as they have the ability to mess up your measurement beyond usability. It helps if the person monitoring is also an operator and colleague, not an outsider or supervisor.
- Be sure why you are taking the OEE. This effort in obtaining the details to the OEE losses is only useful as a first step if you plan a project to improve said losses as the second step. If the only reason for taking the OEE is because someone higher up wants a number, then there are much cheaper ways to get a number (Chinese plants, for example, are well known for simply guessing the right number). Of course, I would never suggest the possibility that this may have happened in Western industries too. 😉
Operator Records
Probably the most common way in industry to determine the details on the OEE losses is operator records. The machine operator takes a protocol of disturbances, which are then converted into digital records and analyzed. For practical reasons, the operators record only disturbances above a certain length (i.e., if there is a stop in excess of 5 or 15 minutes). The advantage is that this data can be obtained with little effort, only the analysis of the data requires some time. On the downside, all stops below the cut-off time are ignored and the quality of the observation may vary from operator to operator.
Making Sense of It All
During the calculation of the OEE, getting the available capacity and the produced parts are probably easiest. Quality losses are also often available or can be obtained by manual observation or operator records. Availability losses are a bit shakier, but manual observation or operator records can also usually give a good picture.
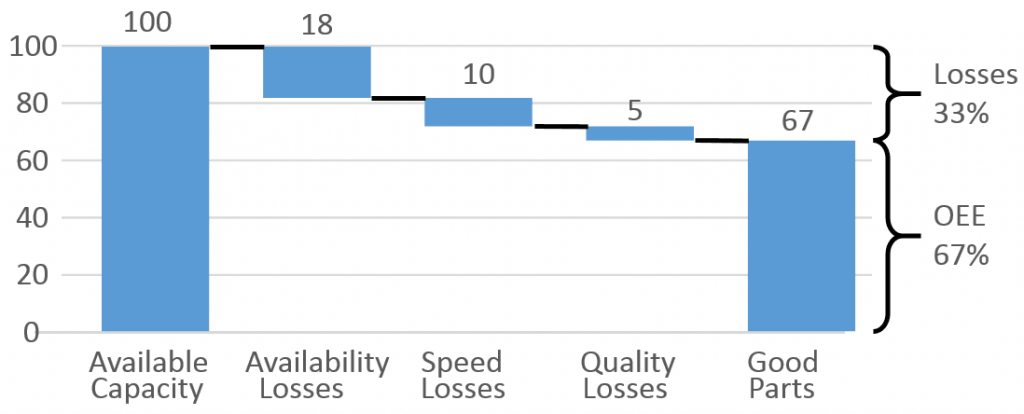
The trickiest part is the speed losses. Operator records and manual observations have difficulties picking these up. What we know for sure is that they have to be the remainder of the gap between the available capacity and the produced parts. In the example below, even if we would not know the speed losses, we could easily conclude that they are 10%, since these 10% are simply the remaining gap. While this tells us the size of the speed losses, it doesn’t help in detailing the causes of the speed losses. Unfortunately, these speed losses are rarely marginal and can easily make up 30% or 50% of the total losses. In this case, you have to dig deeper into the speed losses of the machine.
Hello Christoph,
Thank you for sharing all of your knowledge with us, i have been reading some articles and they are very helpfull so far.
I am currently doing my internship at a company where they have a value added service department. I have to determine the production times so the productivity can be calculated.
While reading this article i came upon a few issues which i don’t know how to deal with just yet when calculating the OEE. Fist of all there are alot of small products which need a label, this takes about 3 to 4seconds (approximately, i havent measured it yet) Then they produce like 5000 of these were there are delays ofcourse. For a next work order the machine has to be configured so the labels are added. Would calculating the OEE per product be smart, and what is thebest way to take on this problem keeping in mind there are alot of different products on 5 different machines. Excuse me if i missed it in this article, english is not my main language.
Hi Ivo, an OEE is always per machine (or more general process). There is no point of doing it for parts. What you can do for parts is the percentage value add vs non-value add. This is usually very low (0.01% or so for many products). The big question, however, is: What do you need the number for? Just doing the number because you can is not really going to make your process better. And: Your English is good, It is not my first language either.
Cheers, Chris.
Hello Christopg thank you for your reply,
I need to know the productivity per machine so a shop floor control system can be implemented which measures the productivity and gives real time information to the person in charge so he can adjust on the work floor. I need to provide the input for the SFC so the SFC can compare the prodcution to my productivity numbers. It however is important to keep the different products in mind while there are different configuration times and perhaps different production times.
Hi Ivo, it seems what you need is the cycle time for each product. Divided by the average OEE this should give you an estimate of the product specific delivery takt time, and hence the productivity. Cheers, Chris.
Hi Cristoph,
I’m working in a batch production environment. I have two questions.
(1) How shall I calculate OEE in case more than one product with different cycle times and different quality ratios is processed in the same machine?
(2) Is it possible to calculate a total OEE for a process where there is more than one machine? That is for instance, there more than 10 casting machines, and the batch can be molded in all of the machines. In this case, would it make sense to calculate a total OEE for the casting process, or shall I continue to calculate OEE for each casting machine?
Hi Murat, 1) for the analyzed period you have to sum up the times for the different parts both under ideal circumstances without losses, and as is with losses. Divide one by the other to get the OEE. 2) For a group of machines it is more difficult, and not recommended. Possible for flow lines, very tough for job shops. You can estimate the maximum output speed of the entire system and then calculate the theoretical minimum time needed vs the actual time needed.
Regarding your answer to my above first question, do you recommend calculating a single OEE for the machine, or shall I calculate OEE for each product passing through the machine?
By the way, your blog is a great work! It is obvious that the blog is not built for a promotional or advertisement purpose. It is really informative. It covers details that most books neglect.
Hi Murat: It depends on what you need the OEE for. If you want to improve a process, measure the OEE of this process. If you want to calculate the number of kanban, you may need the entire system OEE. If you just need a number because your boss told you to get a number, pick the easier one, because it probably doesn’t matter.
Thanks for the comments on my blog, keep on reading 🙂
Great, practical and very helpful article. Thanks Christoph.
Damn informative!! Thanks for sharing such an informative post. Different types of software are available in the market which can help in calculating OEE and downtime tracking of machines. Professionals are recommending “Thrive”and you can also use it to handle unplanned machine downtime problems and OEE calculation Hope this information will help!! Cheers!!
Dear Chris,
I would like to add a comment to the “several part numbers with different cycle times on one machine” case asked by Murat above.
Since OEE is basically a RATIO of times, i.e. the productive time (OK parts * cycle time) vs available time (shift time), one can use this thinking also for the OEE calculation in the case of several part numbers with different cycle times. This is the way to go:
OEE = (OK parts A * Cycle time A + OK parts B * cycle time B + …) / (Available time for producing parts A, B, …)
In case also individual OEE factors have to be calculated, cycle times need to be taken into account (i.e. mulitplied with OK or all parts) only for Performance and Quality factors, whereas Availability depends only on stoppages and not on the cycle times of different part numbers.
In this case, the maths works OK and mulitplication of individual OEE factors gives the same results as the “direct” and short OEE calculation explained above.
Hi Janez, I think the OEE can be calculated only for the mix of production. If you want a “pure” OEE for one product, you would have to produce only one product. For a mixed system it is very hard to derive product-individual OEE’s I think.