
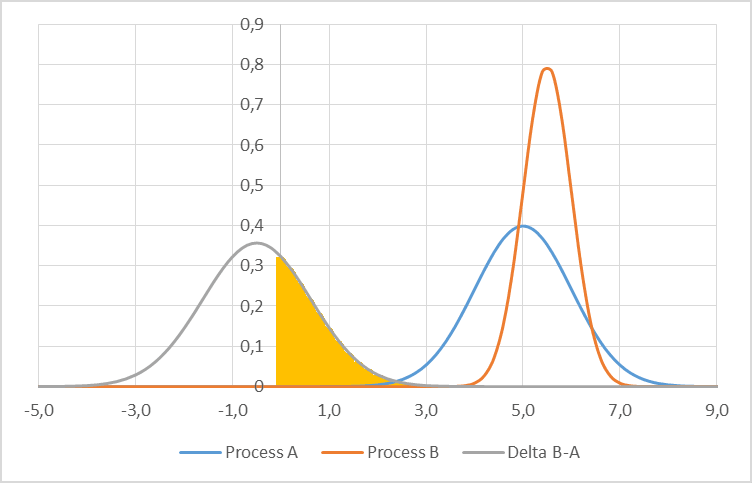
Graph of difference between two distributions
Graph showing the difference between two random distributions. On the right are the two original distributions. On th eleft is the distribution of the difference. The shaded area is the likelihood of distribution A beinglarger than distribution B.
 This work by Christoph Roser at AllAboutLean.com is licensed under a Creative Commons Attribution-ShareAlike 4.0 International License. Please credit the image as shown below. For digital documents and web pages please do include the links as shown below. Thank you.
By Christoph Roser at AllAboutLean.com under the free CC-BY-SA 4.0 license.
- File Name: Graph-Delta-Two-Distributions.png
- File type: png
- File size: 9.75 KB
- Dimensions: 752 x 483
- Date: August 4, 2014
- SEO Title: Graph of difference between two distributions
- SEO Description: Graph showing the difference between two random distributions. On the right are the two original distributions. On th eleft is the distribution of the difference. The shaded area is the likelihood of distribution A beinglarger than distribution B.
- SEO Keywords: difference between two distributions
- Post or page attached: Determining the Size of Your FiFo Lane – The FiFo Formula,