
 In my last post I described a quick-and-dirty approach to estimate the percentage of value add (i.e., the efficiency) of manual work. While the value is only an estimate, it is a measurement that you can take quickly and easily even in passing for a manual workplace. You simply count when a person is adding value and when not (i.e., waste). This post will look into more detail on what numbers to expect, and what to do next if you want to increase this percentage of value adding time. Let’s have a look:
Waste
How to Estimate Value Add for Manual Work – How to See Waste!
 One of the necessary tasks in becoming leaner and improving your industry is to eliminate waste. I like to use a simple approach for measuring waste in manual work to know how good (or bad) the current situation is. To explain my approach I commissioned a few animations. Let me proudly present my approach and my animations, so you can also estimate the efficiency of manual lines when you are on the shop floor.
Karakuri Kaizen Examples
 After an introduction and description of the fundamentals of karakuri kaizen, here are some different karakuri kaizen examples for a wide variety of uses. Most of them are from the 480 exhibits at the the Karakuri Kaizen Exhibition 2017 in Nagoya, Japan; others are from the 2017 OPEXCON in Stuttgart, Germany. Here is my attempt of a structured overview, even though some of the points below may be overlapping.
Fundamentals of Karakuri Kaizen
 Karakuri is the art of creating machines without an external power source. After an introduction to the topic in my last post, I would like to show you some fundamental techniques for karakuri.
I would like to pay particular attention to power management: Where do these machines get their power from, how do they store it, and where does it go? I will also (very !) briefly talk about kinematics, and even some karakuri ideas that go beyond kinematics. My next post will have lots of examples, mostly from the Karakuri Kaizen Exhibition 2017 in Nagoya.
Introduction to Karakuri Kaizen
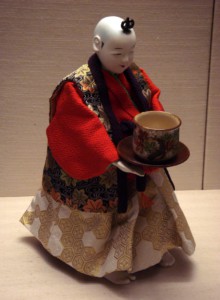 Recently I visited the Karakuri Kaizen Exhibition 2017 in Nagoya. This was a very impressive exhibit, and I learned a lot about karakuri from the many different examples shown there by over one hundred exhibitors. Organized annually by the Japan Institute of Plant Maintenance, it is to my knowledge the biggest showcase of karakuri in the world. This was an exciting visit that I will process in a whole series of blog posts on karakuri (Fundamentals and Examples)
Karakuri is the use of mechanic gadgetry rather than electric, pneumatic, or hydraulic devices. Definitely no computers! Within lean, it stands for mechanical gadgets that improve your system. Time to look closer at what I learned from this karakuri exhibition.
All About Spaghetti Diagrams

A spaghetti diagram is a quick and easy way to track distances of parts and people on the shop floor. The name comes from the result looking like a plate of spaghetti. In this post I will explain the details and give some tips and tricks on how to make a good spaghetti diagram.
Muda, Mura, Muri: The Three Evils of Manufacturing

In its never-ending quest to improve its production, Toyota has identified the three evils of any manufacturing system: waste (muda), unevenness (mura), and overburden (muri). In this post I will explain the concepts behind these three banes of manufacturing.
More On Cuba’s Planned Economy: Cuban Industry
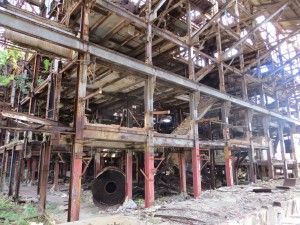
A few weeks ago I wrote an article on the Cuban economy, focusing on commerce (See How a Planned Economy Can Screw Up an Entire Country – Analogy between Cuba’s Communist Economy and Push Systems). On the same visit I not only saw supermarkets, but I also had a look at industry. Unfortunately there are no visitors allowed in their government factories. Nevertheless, I was able to catch some glimpses of different industries.