
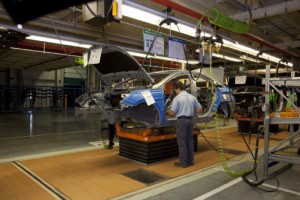
 In my previous post on the automotive assembly line I showed how the earliest chain-driven assembly lines evolved to modern moving platforms. However, in automotive assembly, you also need to work underneath the car. While I have seen truck assembly lines where the entire undercarriage is flipped on its back, in automotive, this is usually done while the car is hanging. Let’s have a look how this is done, and then I’ll wrap up this post with the last bit of the assembly line where the car stands on its own wheels.
Christoph Roser
The Evolution of Automotive Assembly Line—Part 1
 Automotive assembly is one of the pinnacles of modern manufacturing, having a very complex product of 30 000 parts as well as mass production in large quantities. The modern automotive moving assembly line is hence one of the most complex manufacturing operations in the world. In this two-post series I will look at how this changed over time, and the different ways there are to move cars along the assembly line.
The BMW Finger Line Layout
 As part of my grand tour of German automotive, I visited the BMW plant in Leipzig. As of now, this is my second most favorite German automotive plant, after BMW in Munich. I will talk more about this quite well-organized and indeed beautiful plant in a later post series, but in this post I’m going to explain their very interesting and novel way to set up their assembly line. They call this the finger structure or comb structure (Fingerstruktur or Kammstruktur) because the line layout looks like the fingers of a hand or the teeth of a comb. I found this approach quite unique, and hence would like to share it with you.
Variable Takt at Fendt in Marktoberdorf—Part 3
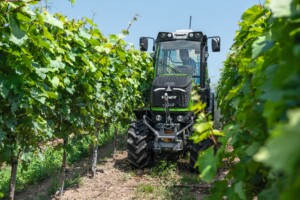
 This is the third post in my series on how Fendt handles its rather large variability. As mentioned before, all of their tractors—eleven different models with countless variants—come from the same assembly line in Marktoberdorf. This includes small tractors that are just barely one meter wide and huge ones as you see here on the left. Imagine assembling motor bikes, cars, and trucks on the same assembly line, and you are getting close to the variability that Fendt has to deal with. Overall, this makes Fendt in my view one of the leading plants in the world in handling variability.
Variable Takt at Fendt in Marktoberdorf—Part 2
 In my previous post I started to show you how Fendt uses the distance between tractors on their assembly line to manage their quite high variability. By changing the distance between parts on the line, you can adjust the takt time for each part on the assembly line, hence the name Variable Takt. But this still leaves a lot of variability, as not all stations will have the same identical workload. In this and the next post I will go deeper into how Fendt manages its variability. This will be good, since Fendt is one of the benchmark plants in the world in handling variability.
Variable Takt at Fendt in Marktoberdorf—Part 1
 In this post I will look at how the tractor maker Fendt handles variability in its plant in Marktoberdorf, Germany. In my view, Fendt is one of the benchmark plants in the world in handling variability. In my previous post I looked at reasons why you may (or may not) leave one part empty on an assembly line with a part normally at every fixed interval. In this post I would like to expand on the idea of playing with the distance between parts to handle such variations in the cycle time, but with a focus on assembly lines where the interval between products can vary. We will look at how Fendt uses this to wrangle its variability.
Using Empty Slots on the Assembly Line
Normally, assembly lines are run with a product in every slot of the line. However, for various reasons, sometimes you may have an empty spot. Depending on your assembly line, you may even play with the general distance between products on the line. The latter is called variable takt, or VarioTakt. In this post I will explain about empty slots on the assembly line, and in the next post I will explain VarioTakt in more detail.
The Two Directions of Poka Yoke
 Poka yoke is Japanese for mistake proofing. It is a way to reduce errors and mistakes by designing the product so that it cannot be assembled or used incorrectly. I find this extremely useful, not only in manufacturing but also in many instances in daily life where poka yoke prevents me from making mistakes. In this post, I would like to talk about poka yoke, and the two fundamentally different directions poka yoke can take.