
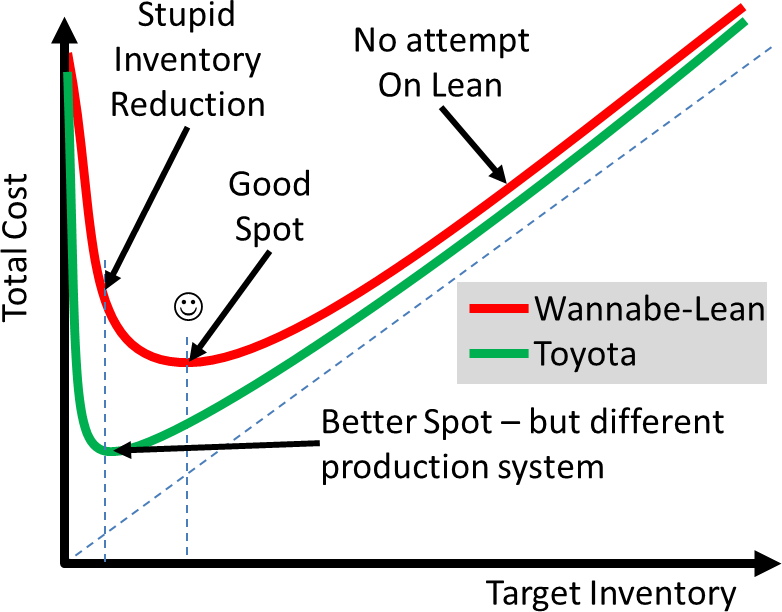
Average and Lean Cost Graphs
Schematic relation between target inventory and total cost both for average and lean companies.
 This work by Christoph Roser at AllAboutLean.com is licensed under a Creative Commons Attribution-ShareAlike 4.0 International License. Please credit the image as shown below. For digital documents and web pages please do include the links as shown below. Thank you.
By Christoph Roser at AllAboutLean.com under the free CC-BY-SA 4.0 license.
- File Name: Average-and-lean-Cost-graphs.png
- File type: png
- File size: 25.02 KB
- Dimensions: 782 x 612
- Date: May 11, 2015
- SEO Title: Average and Lean Cost Graphs
- SEO Description: Schematic relation between target inventory and total cost both for average and lean companies.
- SEO Keywords: lean, inventory, cost, improvement
- Post or page attached: