

In my last post I wrote about four basic factors for an A3 report (one sheet / A3 size / with pencil / on the shop floor). This week I would like to show you what goes in an A3 report. The important framework here is PDCA (Plan, Do, Check, Act). However, in my view there is no single perfect A3 template that will fit all of your problems. Rather, an A3 is created on the go. Make the tool fit the problem, not the other way round!
What Is the A3 Report Good For?

A3 is often used for slightly different tasks. The core use of an A3 report is for structured problem solving. It can also be used for project management. It is also used for status reports on problem solving and project management, although especially with handwritten A3’s, they make sense mostly to the people who wrote them. Some sources also consider the A3 report for planning, although I am not quite convinced. A3-sized sheets of paper are also used to display work standards or other information, although in this case I would no longer call it an A3 report. I associate an A3 report mostly with some type of problem solving.
Generally, the A3 report can help in the transformation from a current state to a (hopefully better) future state.
The PDCA Framework
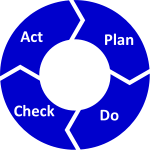 There is one underlying tool that should be present in all A3 reports: the PDCA. PDCA stands for Plan-Do-Check-Act. For me, the PDCA is fundamental for any kind of problem solving or project management. The Plan is to determine the nature of the problem and how to solve it. The Do is the actual implementation. Plan and Do are the two steps that are common in the Western industry. Unfortunately, the next two are often skipped over. With Check, you should check if your Do actually fixed the problem! Act is the step where you try to figure out why your solution from Plan and Do did not work, and how to make it better the next time. Act can also include the sharing of the gained knowledge with others.
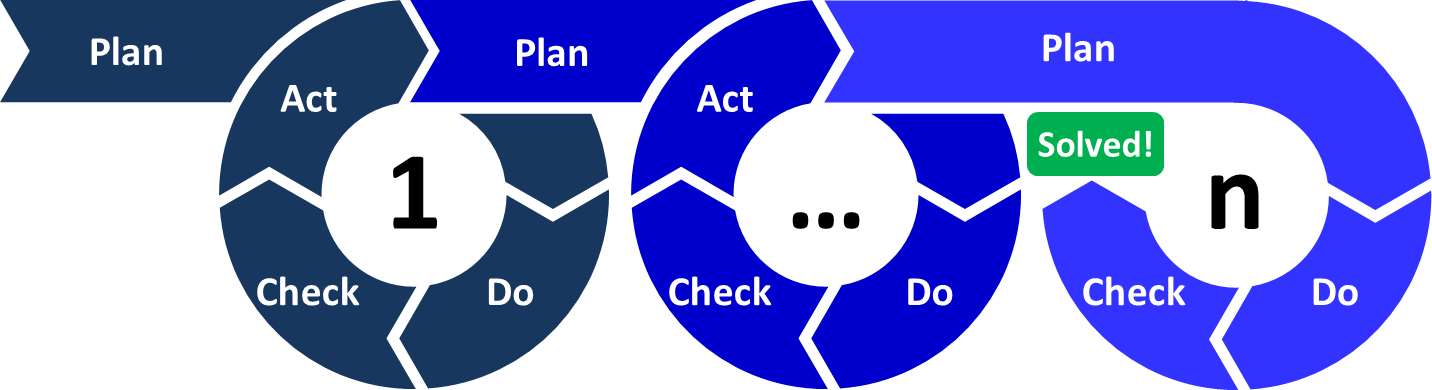
As such, it is a continuous circle. Hence, you could also see it as a series of loops, as shown below, that have to been repeated until the problem is solved. The PDCA is for me one of the essential approaches in lean manufacturing. As such, it has a whole fruit stand full of variants and flavors, including PDSA, DMAIC, LAMDA, SDCA, maybe even KATA, and many more that I don’t know yet (see my glossary for more details).
Typical Content of the A3
Often in literature you find a sample A3 sheet with the explicit mentioning or implicit indication that this is the “right” way to do an A3. However, since there are many different ways to use the A3, I strongly believe there is not a single standard sheet that will fit all problems. I am a strong believer in making the tool fit the problem, not the other way round! Unfortunately, in many lean implementations, I just see exactly this use of a tool regardless if it fits the problem.
In any case, every useful A3 report should be centered somewhat around the PDCA. Which headers and blocks you include depends on the problem you are trying to solve. Do not use one A3 template for everything, but mix and adapt – as long as there is a PDCA. It is okay to use a template, but I recommend keeping it flexible. If, for example, you add a fishbone diagram to your template, you push the user toward a fishbone diagram in lieu of other options. If there are a number of similar-parallel problem-solving activities reporting to the same management, a standardization may have benefits for the management. However, a company wide one-size-fits-all A3 report in all likelihood will fit all tasks equally bad.
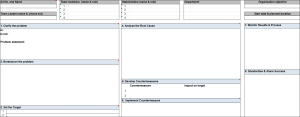
Having said that, here is a list of possible headers or parts to include in your A3 report. You will also find more if you look around different sources. But again, do not use them all but only the ones that help you with the problem at hand. All of the below can include graphics, diagrams, layouts, sketches, etc. if needed. And again, one sheet, A3 size, with pencil, on the shop floor!
Plan

- Background: What are we looking at, which part of the plant/product is under investigation, what is the business case?
- Current State or Initial Condition: What is the current situation?
- Problem Statement: What problem do we actually try to solve?
- Target Condition or Targets: What do we want to achieve? What are our (numeric) targets?
- Problem Analysis or Root Cause Analysis: What is the cause of our problems? You could use a fishbone diagram, a 5 why approach, or any other problem solving method useful to you.
- Solution Comparison: Which of the possible solutions has the best chance of being successful for a reasonable effort? Which solution idea should be implemented?
- Proposed Solution: What is our approach to fix the problem?
Do

- Next Steps, Corrective Actions, or Implementation Plan: List of actions that need to be done to implement the proposed solution.
- Schedule of Implementation: Deadlines, planned and/or actual start and completion dates, status (open/in progress/done). Is often combined with the next steps in one table.
- Responsibilities: Who is in charge of which step? Can also include other functions as, for example, Accountable, Consulted, Informed, Support, etc. Can also be included in the Next Steps, but be wary of overdoing it.
Check

- Indicators or Targets: Comparison of the target conditions to the current conditions. This is especially interesting after implementation. It is often shown as a timeline or a graph. It is also often combined with the Targets from the Plan above. Please note that one swallow does not make a summer, and hence achieving the targets once doesn’t mean you have achieved it. The situation has a tendency to revert to its old state as soon as management’s attention has passed on to the next topic.
- Monitor Results or Process: Keeps track of the effect of the implementation and changes fro the Do step.
Act

Hopefully you may not need this if the problem is solved on the first try. Actually, most A3 reports do not include the Act part. It is somewhat negative and depressing to include a “Why it did not work!” section after all that “What we did to make it work!” before. I myself often do not include it from the start. However, if the problem is not yet solved despite some changes (improvements?), you would need to add this. You do not need to have it from the start, but you need to be mentally prepared to go through the Act if you need to. Nevertheless, there are some possibilities for a general and more positive Act on the A3 sheet:
- Follow-up Actions: What are the next steps?
- Share the Successful Ideas with Others: Sort of a fig leaf Act on A3 reports. The idea is to share the good results with others. Since it automatically implies that there are good results after the first try, I feel that it pushes you away from analyzing “Why it did not work?” if it did not work.
- Update Standard Work Sheets: Naturally, a successful change in a standard would need to be added into an updated work standard sheet.
Miscellaneous

On top of all that, an A3 can include a lot of additional general project-related data:
- Title
- Reference numbers
- Date of report
- Project team members, project owners
- Stakeholders
- Contact information
- Part numbers
- Section manager or patron (which gives an upper manager the possibility to add his name without being responsible if it does not work 😉 )
- Signature fields, possibly even for different steps to get approval from others and management, or just at the end confirming that the section manager has accepted the successful project
- Budget/expenses
Summary
As mentioned above, you need to make the tool match the problem, not the other way round. In any case, there are still many things that can be done wrong when doing an A3 report. I will write more about the mistakes and limits of the A3 report at a later time. Until then, however, I hope the above summary was useful for you. Now go out and organize your industry!
Series Overview
- The A3 Report – Part 1: Basics
- The A3 Report – Part 2: Content
- The A3 Report – Part 3: Limitations and Common Mistakes
See also
Roser, Christoph. “Der A3-Report: Mehr Als Nur Eine Problemlösungsmethode.” Yokoten 5, no. 3 (2016).
Good information
Very good website.
CIP & Kaizen & Pokya-Yoke etc. all belong to Lean production?
Thanks Kai. All the terms you mentioned are usually associated with lean. See my Glossary for many more, although some of the terms are not “Lean”, and others are not common.
Christoph, thank you for the interesting and insightful article,
As you said: “Generally, the A3 report can help in the transformation from a current state to a (hopefully better) future state.”
Do you use A3 in every problem solving? (I’m not talking about trivial one-step-solution problems of course) and if so, in what stage do you use it? What preliminary work needs to be done and by whom prior to using this tool?