
 In my series of posts on the Toyota KPI dashboard I went into detail about the different sections and KPIs. These dashboards work well fro Toyota. However, this does not mean that they automatically work well for you too. Chances are, you are not making cars. Even if you are, your relevant KPI information may be different from Toyota’s. Let’s have a look…
KPI
Key Performance Indicator – or KPI – are measurements regarding different shop floor performances.
The Toyota KPI Dashboard—Production Plan
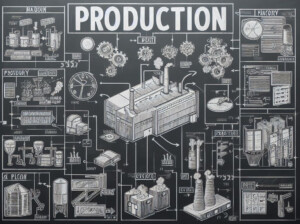 In my previous posts I went into great detail through all the categories of the Toyota KPI dashboard: safety, quality, productivity, and cost. I also explained the additional section on HR development, albeit this may not really be KPI in the normal sense. However, the dashboard often contains even more: a section with the monthly production plan, a section for the allocation of the operator, and different A3s for improvement. Lets dig deeper:
The Toyota KPI Dashboard—Human Resources
 With the KPI groups safety, quality, productivity, and cost, this series on the Toyota KPI dashboard has covered the main topics. However, there is more. Not always but often you can also find a section on human resources (HR) development. Yet, these are usually not KPI, but more organizational topics that may be part of the daily shop floor meeting. Below are some examples of how this section could look, although this may vary quite a bit among different Toyota plants. Let’s have a look:
The Toyota KPI Dashboard—Cost
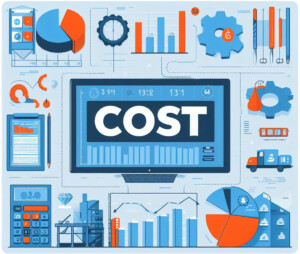 In my series on the Toyota KPI dashboard, after safety, quality, and productivity, we finally arrive at cost. While for some companies it is the number one factor, for Toyota it is far behind safety, quality, and productivity. The argument is that if safety, quality, and productivity are in line, it is likely that cost is also good. Both a lack of quality and a lack of productivity will drive up the cost.
The Toyota KPI Dashboard—Productivity
 This post in my series on the Toyota KPI dashboard looks at productivity. After safety and quality, this is the third-most-important KPI group on the Toyota dashboard. The cost is least important. This section of the dashboard measures different KPIs on the productive output of the system. Let’s have a look.
The Toyota KPI Dashboard—Overview
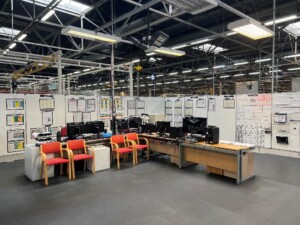 Dashboards, in their many forms, are essential to track the performance of a production system. In this post I will talk more about the Toyota shop floor dashboard. A lot of the information is from Toyota in Japan, but the images are from Toyota UK. Keep in mind that the dashboards are not a rigid standard and there may be differences in how they are implemented in the different plants. For one thing, in Japan they are in Japanese, and in the UK in English, but there are also differences within the KPI itself. Let me tell you more in this short series on the Toyota KPI dashboards…
Dos and Do Nots for KPIs
 A key part of managing your shop floor is understanding the current state of the shop floor. And KPIs are an important part of understanding the shop floor. But this is also not always easy. In my experience, the three most common pitfalls are to underestimate the effort (and hence the cost) of measuring a KPI, to overestimate the accuracy of a number, and (worst of all) to believe that the numbers tell you everything. Time for a reality check…
The Many Different Flavors of the OEE
 If imitation is the sincerest form of flattery, the OEE (Overall Equipment Effectiveness or Efficiency) is indeed one of the most appreciated measures in lean. I counted at least eight different variants and adaptions of the basic OEE – although let me tell you that I am not impressed with all of them. Many of them seem to be theoretical academic constructs with little meaning for your shop floor. Also, identical acronyms and similar terms are often used in a completely different way, adding quite a bit to the confusion. On top of that, I think the OEE is used way too much in industry where it does not make sense, and many OEE numbers are heavily fudged. Anyway, let me show you the many different flavors of the OEE.