
 Dashboards, in their many forms, are essential to track the performance of a production system. In this post I will talk more about the Toyota shop floor dashboard. A lot of the information is from Toyota in Japan, but the images are from Toyota UK. Keep in mind that the dashboards are not a rigid standard and there may be differences in how they are implemented in the different plants. For one thing, in Japan they are in Japanese, and in the UK in English, but there are also differences within the KPI itself. Let me tell you more in this short series on the Toyota KPI dashboards…
Introduction
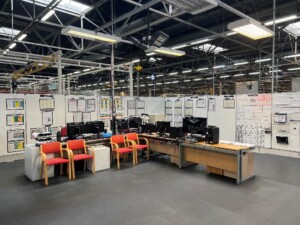
 Toyota is excellent at tracking information… AND actually using it! One thing that always surprises me at Toyota plants, no matter where in the world, is the amount of paper on the walls that tracks or manages different aspects of the plants. For example, at a recent visit to the Toyota UK Deeside engine plant, the section manager for the final assembly had a whopping 50 meters of whiteboard filled to the brim with paper (plus a large stack of older sheets on a table), which he went through with his team every day. Admittedly, only around 8 meters of these were the KPI dashboard, and for example there were an extra 20 meters of whiteboard due to the final assembly line having trouble making its 44 second target tact reliably, and they were relentless in tracking down and eliminating disturbances. The manager hopes that once the line is back on track, he can stop the extra 20 meters of line breakdowns and go back to his usual 30 meters of whiteboard daily in different meetings. But chances are that the next project will fill the extra 20 meters of whiteboard again.
 Also, as mentioned above, there is not THE ONE STANDARD for dashboards across all of Toyota. Plants, and even sections, have the flexibility to adapt the KPI to their needs. The data sheets may look different, A3 sheets may have a different layout, and the KPI may differ slightly from each other. Similarly, you should not merely copy Toyota because it is Toyota, but instead adapt it to your needs. Toyota tracking the production output on an hourly basis works well if you make 100 pieces per hour, but this would not work if you make airplanes with a plane being completed every week. So, use this as inspiration, but not as a template!
Dashboard Overview
However, while the dashboards may differ across Toyota, they all contain the same main headings. The first one is always safety, because everything at Toyota starts with safety. The next one is always quality, because at Toyota the second most important aspect is quality. After that comes productivity, tracking the output, efficiency, and inventory. Finally, there is cost, because if the other three are good, then the cost will follow. Most dashboards also have a section on the development of the operators. On top of that, most dashboards also include a section on planned production output and assignment of the operators to the different processes. The A3 sheets of the key improvement projects and problem solving are also usually included.
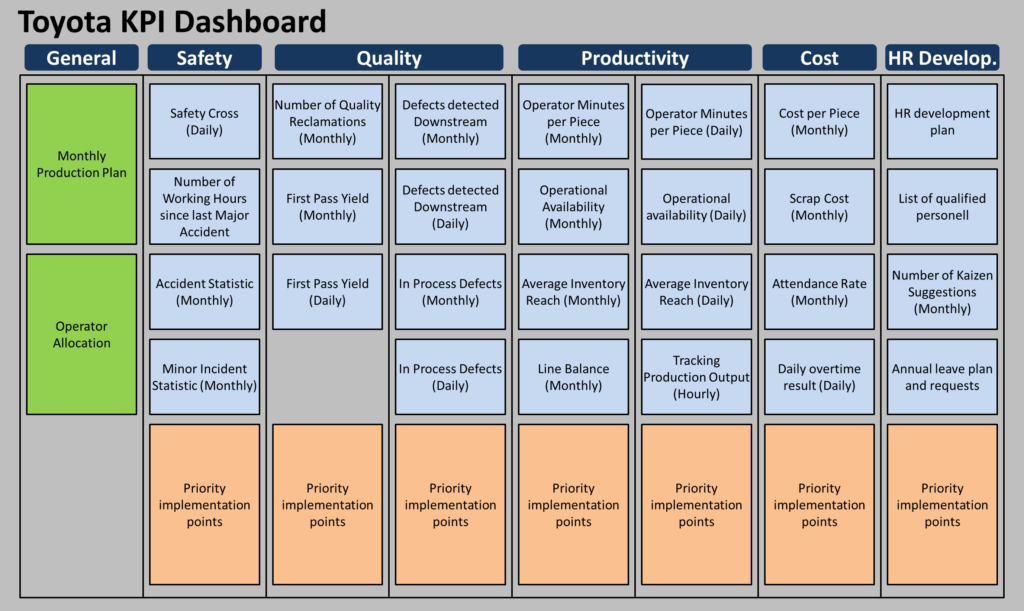
Most of the sheets are typical A4 sized paper, usually pre-printed and filled out by hand, although some data was also printed along with the sheet. For A3’s they also used (surprise) A3-sized paper. Some areas like the operator allocation is often done using magnets labeled with the names of the operator, placed on a plan or value stream of the section.
Dashboard Usage
These dashboards are discussed at least every workday, and quite likely every shift as part of the shop floor meeting. Similar meetings are also held on a daily basis at higher levels in the hierarchy, and the plant manager regularly attends shop floor meetings too. As part of the Toyota UK visit, I also observed such a meeting headed by the section manager. The amazing part was how quickly they went through the sheets, focusing only on the relevant issues, without wasting time for extended discussions.
As I mentioned before, the section manager discussed 50 meters of whiteboard with his team every day. That sounds like a lot, because it IS a lot! It takes quite some time to discuss all these details. But these pale compared to the time it takes to fill them out! Besides, you don’t just want any data on the sheets, you want reliable data for making decisions.
 If you are now worried how to do this in your plant, chances are, you can’t. Toyota has quite a lot of manpower on the shop floor to do just that. I wrote before on the Team Structure at Toyota, and there is one team leader for every 4 operators, and one group leader for every 4 team leaders. The task of these blue-collar leadership levels is to a) support the operators on the shop floor, b) do kaizen, and c) record data, usually by hand. Hence, Toyota has much more manpower on the shop floor for such organizational and supporting tasks, which has been sacrificed in the name (but not in the spirit) of efficiency. Hence, when implementing dashboards at your company, ensure the demand on the dashboard matches what your organization can provide!
In my next few posts I will go in more detail on the KPI groups of safety, quality, productivity, and cost, plus some of the other topics. Now go out, keep on reading, and organize your industry!

PS: Many thanks to Mikako Lenquist from C2U in Sweden for organizing the Lean Leadership System in Japan 2023, where former Toyota factory manager and Director in charge of TPS promotion Akinori Hyodo shared his wisdom. Most of the data in this post series I learned from this tour.
Additional thanks to the team from the Toyota Lean Management Centre at the Toyota UK Deeside engine plant in Wales, where I participated in their 5-day course. This course gave us a lot of access to the Toyota shop floor, and we spent hours on the shop floor looking at processes. In my view, this the only generally accessible course by Toyota that gives such a level of shop floor involvement (albeit they want to open another center at the UK Burnaston final assembly plant).
Both the C2U Lean Leadership System course as well as the Toyota Lean Management Centre 5-day course are highly recommended!
Thanks for sharing
HI Chris,
Could you please elaborate what is the tracking parameter for the KPI LINE BALANCING (MONTHLY) under productivity? Is it conformance to OUTPUT based on the established Line Balance Charts or the attempts at improving on the current status of Line balancing?
Regards.
Hi Jay, good to hear from you again. I will have subsequent posts with more details on all sections and examples of individual sheets and how to calculate them. Stay tuned…
I much prefer this system to go by the acronym FMDS. Floor Management Development System. It very much allows you to evaluate how well the particular leader is running their area. It starts at the top of the organization and cascades down. As leaders advance in the organization, how they manage their new responsibility does not change. The key is to surface problems and make them visual. I could go on . Excellent article.
Hi Chris,
great topic and great post!
I visited the TPCA (Toyota-Peugeot-Citroen Auto) assy plant at Kolin in Czech Republic approx 15 yrs ago. And yes, they also had meters of walls covered with paper in ths shopfloor. We wondered whether it’s all REALLY being used or not, because we did not have a chance to witness the meetings. I see now from your post that it most probably was really used.
I am looking forward to the next posts.
Janez
Hi Chris:
Excellent article, but you said “50 meters of whiteboard”. That is, well, a lot of meters. That means 166 A4 in a row, and with six rows equals 996 A4’s! Is that really true?
Hi Joel, the 50 meters included all kinds of paper format, including A0 or A1 printouts of tables with details on the individual processes of the assembly line (this was the 20 meter special project to get the takt to 44 seconds). And, not every number of every sheet is discussed, otherwise the week would be over before they go though the first day. But many of them get filled out by hand by people on the shop floor on a daily or even hourly basis!
HI Chris,
Thanks for the response to my query on LINE BALANCNG KPI.
Hello Chris,
I find it quite interesting that, in my experience, most companies I have visited have some form of OTD tracking. Why aren’t they tracking it here, or are they tracking it but at a different level? Here’s my uneducated guess: they may be prioritizing productivity & quality, and as long as their output meets demand, they consider themselves on time. However, this approach neglects the critical role of logistics.
Thanks
Hello Chris, Thanks for the great information… S, SQPC-HD is the base principle of Toyota and is practiced in letter and spirit…. We have been trying this in our shop floor, and, it was a.huge success….. SQPC with visual display in easy to understand is THE Formula…
looking for more from you…..
Great post! I think it interesting how in a world that seems to be moving more towards virtual information tracking and delivery, Toyota is still using somewhat of a paper and pen method. While the adaptability of using paper and pen speaks for itself, I’m surprised shareholders haven’t fought back against this with environmental and recycling concerns. Either way using these whiteboards in daily meetings in regards to figuring out how to be more lean is great to see in such a large corporate company such as Toyota.
Well-presented and very informative, even for someone who is exposed to the process on a constant basis.