
 Regular meetings are necessary to keep yourself and others informed. This is also true for the shop floor. Many factories have set up meeting corners for the workers and their supervisors to meet. In this series of posts I would like to show you what you need for a successful shop floor meeting. This first post looks at the hardware and content of the team corner where the shop floor meeting usually happens, as well as the most important KPI that should be addressed in the team meeting.
Team Corner Hardware
 Most team corners consist of a few whiteboards in an area not too far from the actual workplace. These boards are either permanently mounted or can be movable. Often they form three sides of a rectangle. The fourth side is open so people can walk in and out.
A tall table is often also part of the team corner so participants can put down their clipboard or coffee cups. However, there are usually no chairs. A standing meeting helps to make the meeting shorter and more active. Hence, avoid chairs. Besides, there usually is not enough space for chairs for everybody anyway.

Other pieces of common equipment are whiteboard markers in different colors and an eraser. Some corners hang up these markers with strings, others have a small magnetic tray on the whiteboard itself. The most basic option is to put them on a table, although these tend to go lost most often too. Make sure these are all non-permanent, otherwise you will end up with a very messy whiteboard. Additional writing equipment like pens or text markers are also often available. If necessary, a cheap calculator may also be part of the set.

Some companies also include computers with displays and keyboards/mouse/tablets. These have the advantage of being able to show a lot of data that is available on the network. The disadvantage is that I have never seen them used. I guess it helps the bosses to feel more “Industry 4.0,” but workers usually don’t use it, partially because they are not that easy to use. If you believe they help your team, feel free to get these, but otherwise avoid.
On the other hand, feel free to use different non-digital tools. I commonly see (and like) small magnets in different shapes to highlight or indicate items. Red, yellow, and green round magnets can be used for a traffic light system to show if something is good, barely OK, or a problem. Magnetic arrows with labels can point out different things (i.e., “today’s person in charge” or similar). Magnets can indicate which worker is at which machine today. If you buy magnets, get the stronger magnets. I once made the mistake of buying cheap and weak ones, and the magnets frequently fell off if someone walked past the paper it was on.
Use Pen & Paper Whenever Possible
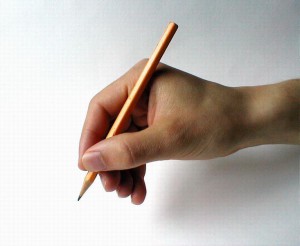 Many companies like to work with computer printouts for different data charts. They look nice, but they lock out the worker from interacting with the data. Try to use handwritten data instead. Provide blank forms, and have the employees fill out the data every day themselves. See The Advantage of Handwritten Data on the Shop Floor for more detail. Toyota and many other Japanese companies even use pencil so mistakes can be corrected easily.
KPI in the Team Corner
The team corner should have different information and data in it. Typically there is one or more data sheets for each of the following categorizes:
Safety
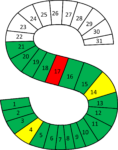 The first and possibly most important section is safety. What accidents happened? How many days since the last accident? A popular format is a S-shape with the days of the month (or week). The “S” stands for safety. Every day has its own field. Another variant is similar but shaped like a cross (for the first aid cross), with square fields numbered 1 to 31. Feel free to use a symbol or letter that fits your culture. For example, Muslim countries may prefer a crescent instead of a cross.
 Every day the safety status of the previous day is added by filling out the previous day. Different colors can represent different things. A green field stands for no accident. A yellow field could be a minor accident that required some medical aid, but no sick leave. A red field would be a major accident that requires sick leave. Gray could be days not scheduled to work. You can also add colors for near misses.
At one glance you can see how safe the section was. Details would have to be looked up elsewhere, but the previous months of data are often kept in the team corner behind the current month. Just in case you want to use this safety S or safety cross numbered from 1 to 31 for the days in the month, I have here a free Safety S and Cross Template that I made myself. Feel free to download the template and use it. If it helps you to reduce accidents, then I am happy 🙂 .
Quality
Another important factor that is usually represented is quality. Depending on your product, you should show a few of the most important quality measures. Ideally, these are represented as a bar graph over time, possibly with upper and/or lower limits or targets. This allows you to see trends and the quality history. Avoid just filling out a table with numbers. A graphical representation is often much easier and quicker to understand! Similar to safety, the charts from the previous months/weeks are also often kept in the team corner.
Make sure to have enough space on your chart toward the “bad” direction. I knew of one plant that invested quite a bit of money into a electric quality performance display with colored lights for the plant entrance hall, only to have quality turn sour shortly thereafter. The quality was literally “off the charts” for every visitor that walked in. You may make comments directly on the paper if necessary.
Performance
 Another important measurement is the performance of the production system. This could be productivity. How many items were made yesterday? Or it could be some sort of cost measure. Use whatever is common in your area. Similar to quality, this is often a timeline of the performance of the previous days. Most commonly you see the number of items produced per day or per shift, but use whatever is commonly used in your company.
In my next post I will look at some more items that are commonly found in team corners for shop floor meetings. Until then, go out, meet some people on the shop floor, and organize your industry!
Series Overview
- How to Set Up a Shop Floor Meeting – Part 1
- How to Set Up a Shop Floor Meeting – Part 2
- How to Conduct a Shop Floor Meeting
Cristoph – shop floor meetings are the essence for creating the culture of LEAN – embedding the behavior in all workers by making it part of their job to share learnings and ideas. Also key for sustainability, part of the daily process then leaders can customize the agenda as new employees are added and others are promoted, depart, etc. Great post!
Hi Christoph, I would like to know if you have any other ideas regarding Lean and the pandemic situation. It will be of great help during this days. Many thanks.
Hi Thomas, I am not an expert on Virology, but can just repeat what is said elsewhere: Keep distance or avoid people altogether, wash hands with soap (or hand-sanitize as a secondary choice), wear masks, don’t touch your face, use online video meets, put up plastic or other barriers, etc.
This of course does not always fit in well with a shop floor, but it is bad if the staff gets sick and the plant will be closed – as for example a few slaughterhouses I read about on the news.
One option done in a few plants is to man a line with only half (or less) of the people to increase distance, but reduce output. The examples I know are automotive, who can’t sell their cars right now anyway, so reduced output is what they need right now anyway.
Stay safe and wash your hands!
Hi Christoph,
Nice post.
It seems to me that building a shop corner should start from what people want to know (your example of “person in charge today”) will help to make it a tool used and not a mandatory dictated by the boss.
The shop corner permit also to transmit information top to bottom, but must not be only that. People on shop floor usually know if the day earlier was good or not…
Construction of the shop corner with the team helps to define the good KPI and how to communicate them
Waiting for the next part!
Hi Christoph!
Shop Floor Meetings give out the smell of the lean culture in any factory!
With regards to performance management, what are your view on Digital Performance Management? Where there are Business Intelligence Dashboards that display all the production metrics like Planned & Unplanned Stops, PR & Maintenance for the shift as well as Scrap rate.
Hi Shreyas, I have seen a few digital boards, but always on trade shows and never in the shop floor. They are better for management, but my gut feeling is that the workers often hesitate to interact with the board. The dialogue of the team will often turn into a monologue of the supervisor that controls the board. Pen and paper is much easier.