
 In my last post I showed you an overview of the Toyota KPI dashboard. This time I will look in more detail at the first (and arguably most important) section on safety. And, while I’m at it, let me also tell you some more about safety at Toyota.
Introduction

Toyota likes to say that it puts “safety first.” And, indeed, it feels like there is a lot of attention on safety. While of course there are occasional accidents, these are very few. For example, a Toyota Boshoku plant in Aichi that I visited had gone 647 days since the last accident. The target for this was 1320 days (or 3 1/2 years, since the record so far at this plant was 1312 days without accident (from 9.9.2015 to 12.01.2021).
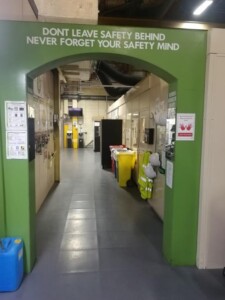
 Every Toyota plant in the world that I have been to has a “safety gate” at the entrance of the plant. This symbolizes that an employee entering the plant is responsible for his own safety (and that of others). The earliest Safety and Health Committee and organized Safety Week activities at Toyota Motor date back to 1938, only a few years after its founding in 1933. Their goal is zero accidents, focusing especially on dangers from (1) moving machinery, (2) heavy objects, (3) contact with vehicles, (4) falls, (5) electric shock, and (6) high temperatures.
 Safety is also one of the main headings of the Toyota Hoshin Kanri, their structure for setting targets from the top down across all hierarchies. I even found reminders on safety on the back of some of their high-visibility safety wests, stating “If I bet with my life, I gamble with safety.” (Although to me this would read better the other way round: “If I gamble with safety, I bet with my life.”)
Toyota Safety Dojo
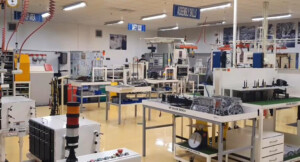 New employees get two weeks of training in a training center (a dojo) on how to work properly in the factory. This is not some complicated technology like welding, but simply for working on an assembly line. A big part of this is safety.
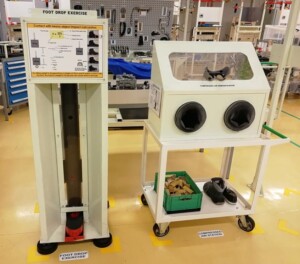
For example, at one station they had an demonstration where a weight is dropped on a bamboo piece in a normal shoe… which shatters the bamboo piece. Next it is dropped on a bamboo piece in a safety shoe, and the bamboo is unharmed. Other different exercises also enforce the concept of safety.
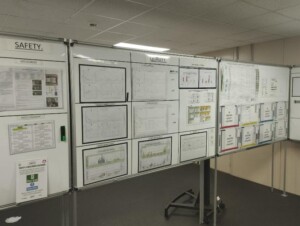
The Safety KPI Dashboard
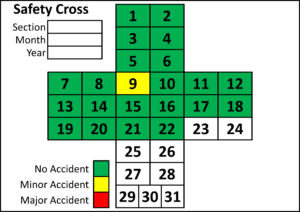
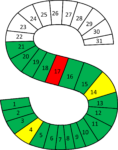
But the main topic of this post is the KPI dashboard and its section on safety. Keep in mind that while the main topics are the same across all Toyota locations, the data sheets within can vary quite a bit. Plants are free to adapt the documentation to suit their needs. But one thing I found pretty much everywhere is the safety cross. This is a simple cross with the days of a month (i.e., 1 to 31). Every day the previous day is filled out. Green stands for no accident. Yellow stands for a minor accident. And red stands for a major accident. Throughout the month a very visual representation of the safety statistic emerges. Similar visualizations are used in many plants. If for religious reasons a cross is undesirable, I have also seen a safety “S.”
 Below that you often find additional statistics on safety. Very frequently, the “days since the last (major) accident” are listed as a big number. This can also vary, and I also have seen this number measured in working hours since the last (major or minor) accident.
Next often follows an overview of the year so far, showing for example the number of accidents last year, the target, and the number of accidents each month. A cumulative line counts up how many accidents happened since the beginning of the year, and shows clearly if the target can be reached or if the cumulative line approaches or even crosses the target. Often, these values distinguish if it was a major accident with sick leave, a minor accident that caused a line stop, a minor accident that did not cause a line stop, or a near miss. By its nature, near misses are often underreported, but there is at least an attempt to catch these. After all, statistically speaking 20 near misses cause a minor accident, 3 minor accidents cause a serious accident, and 10 serious accidents cause a death. Hence, trying to address near misses can help to prevent minor or major accidents. The example below looks like one of these sheets, but of course the data added is completely fictional by me.

A very similar sheet can be used to track minor incidents, also with last years numbers, targets, monthly incidents, and a cumulative line. Below is an example, again with completely fictional data.

The safety section can be rounded up with details to the last major accident and the actions done to prevent this. This completes the section on safety of the Toyota KPI dashboard. Next week I will talk more about the second-most-important topic at Toyota, quality! Now go out, improve the safety fo your people, and organize your industry!
PS: Many thanks to Mikako Lenquist from C2U in Sweden for organizing the Lean Leadership System in Japan 2023, where former Toyota factory manager and Director in charge of TPS promotion Akinori Hyodo shared his wisdom. Most of the data in this post series I learned from this tour.
Additional thanks to the team from the Toyota Lean Management Centre at the Toyota UK Deeside engine plant in Wales, where I participated in their 5-day course. This course gave us a lot of access to the Toyota shop floor, and we spent hours on the shop floor looking at processes. In my view, this the only generally accessible course by Toyota that gives such a level of shop floor involvement (albeit they want to open another center at the UK Burnaston final assembly plant).
Both the C2U Lean Leadership System course as well as the Toyota Lean Management Centre 5-day course are highly recommended!
HI Chris,
I have a doubt on the following:
The target for this was 1320 days (or 3 1/2 years, since the record so far at this plant was 312 days without accident (from 9.9.2015 to 12.01.2021).
Did the factory work only 312 days in almost 5 plus Years from 9.9.2015 to 12.02.2021?
Hi Jay, you are completely correct, there was a typo, it was not 312 but 1312 days. Thanks for catching that!
Hi Chris, same reflection from my side.
Additional : Do you have a video of the training center?
I have 16 LSR training center for our employees in the structural concrete manufacturing.
Regards
Dirk Van Akelyen
Hi Dirk, sorry, but I don’t have a video of the training center.
Christoph, does toyota not have any leading indicators/metrics on Safety? I am a bit confused as what I read in the article are lagging (requiring reactionary countermeasure). Please advise.
Let me rephrase my question. You mentioned it (but I missed it, fast reading the article) “near misses are often underreported, but there is at least an attempt to catch these.”
Near miss is one leading indicator to assess and prevent unforeseen situation that can put human, machine, material and/or environment at risk.
Why do they get underreported and what can be done (best practices known) to capture them holistically?
Hi Ashok, A “near miss” is something where nobody got injured. So from the view of many operators, “nothing happened”. But from a safety perspective, it is a warning that next time it may not be a miss. Hence, this is often under-reported. To improve this, you have to make your worker sensitive to the problem, which is not easy.
Hi I’m looking to speak to someone about the safety dojo and some of the stations they have designed.