
 In this third post of my series on the Toyota dashboard we will be looking in more detail at quality. The quality of Japanese car makers in general and Toyota in particular is quite a bit better than the rest of the world’s. After safety, quality is the second-most-important issue at Toyota, definitely before productivity and cost. They do put in quite some effort for tracking quality… and then put in even more effort to fix these issues! Let’s have a look:
Introduction
From the Toyota point of view, quality is second only to safety in importance, and definitely less important than cost. This is also reflected in the sequence on the KPI dashboard, including the sequence in which it is discussed every day. Toyota puts a lot of effort into quality, and quality circles and other quality-related improvement efforts are firmly part of Toyota.
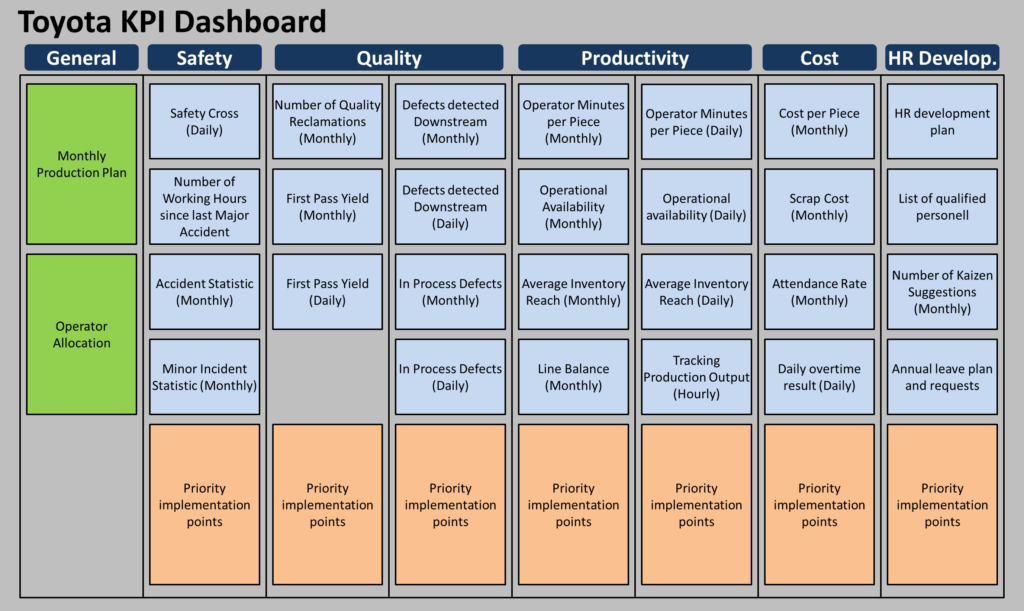
On the dashboard this is represented through statistics of different quality measures, both on a monthly and on a daily basis. Note that this may also differ among different Toyota plants, depending on which KPI are commonly measured or available. As in my previous posts, the example is from Japan but the images are from the UK. The example from Japan measured four different variables: the in-process defects, the first pass yield, the defects detected downstream, and the number of reclamations. This corresponds to the locations on the value chain where the defect is detected (Note: Defects in raw materials are not part of the KPI of the processes, but would be a KPI for a preceding location). Depending on where you are on the value stream, this may look different for you.
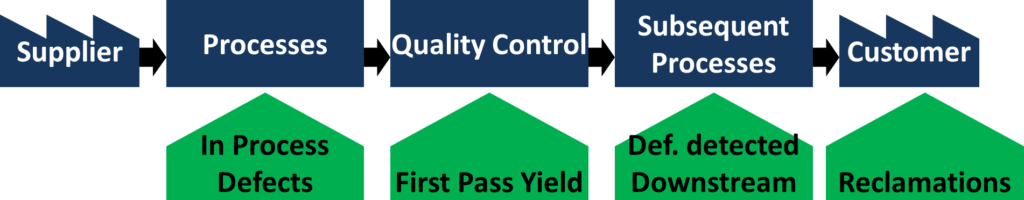
Naturally, the earlier you detect a defect, the easier and cheaper it is to fix.
Reclamations
The worst types of defects are customer reclamations, as these defects have impacted the customer. Keep in mind that not all customers will complain about defects, and some will not inform the company but still may have a bad impression. The number of defects at the customer is usually larger than the number of customers that complain about them.
At Toyota these are measured on a monthly basis. Below is an example with fictional data. It shows the number of reclamations from the previous year, the target (zero reclamations), and the monthly number of reclamations. A cumulative line is also included to show the trends.

Defects detected downstream
The number of defects detected downstream—but still within the company—uses a very similar chart. There is the value from last year, the target, and the monthly detected defects. A cumulative line shows the trends.

Different from the reclamations, however, these were in my example also measured on a daily basis. The chart itself is similar, with an example shown below. However, it may not always include a cumulative line.

First Pass Yield
The first pass yield, also known as throughput yield, measures what percentage of your produced units were of good quality. This sheet includes some more data on how the number is determined—in other words, it includes the total production, the number of defects detected at the quality control, and the corresponding first pass yield (FPY). Below is again an example with fictional data.

This value can also be displayed on a daily basis. The sheet is similar to the monthly one, except that the annual one shows the value of the previous year, whereas the monthly one does not show the previous month. But since the monthly data is on the other sheet anyway, this is not needed.

In-Process Defects
Finally, we have the defects that were detected within the production process (e.g., the assembly line), but before quality control at the end. The sheet itself is very similar to the defects detected downstream. Below is an example with fictional data.

This sheet also exists in a version with daily data; a (fictional) example is shown below.

Summary
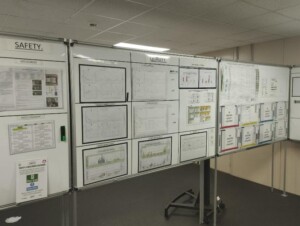
Overall, Toyota measures quality at different stages of the value stream. This can of course differ between different plants. The composition of the data can also differ, with some plants having more data on the sheets than others. The photo here is from the Toyota UK Deeside Engine plant. One or more descriptions or problem-solving sheets for quality issues are also often found on the daily KPI dashboard.
Is this KPI structure the right one for you? Maybe, maybe not. You should definitely track your quality. However, the extent to which you track your quality depends very much on your needs and (which is often forgotten) on the capacity and time that your people have available to do so. It is pointless to track lots of quality data if you never actually use it. Toyota is quite relentless in following up quality (and other) issues in their plant, and they do have the people available to take care of these problems (which may be a topic of a later blog post). Now, go out, track AND improve your quality, and organize your industry!
PS: Many thanks to Mikako Lenquist from C2U in Sweden for organizing the Lean Leadership System in Japan 2023, where former Toyota factory manager and director in charge of TPS promotion Akinori Hyodo shared his wisdom. Most of the data in this post series I learned from this tour.
Additional thanks to the team from the Toyota Lean Management Centre at the Toyota UK Deeside engine plant in Wales, where I participated in their 5-day course. This course gave us a lot of access to the Toyota shop floor, and we spent hours on the shop floor looking at processes. In my view, this the only generally accessible course by Toyota that gives such a level of shop floor involvement (albeit they want to open another center at the UK Burnaston final assembly plant).
Both the C2U Lean Leadership System course as well as the Toyota Lean Management Centre 5-day course are highly recommended!
Hi Chris!
Thanks for this series of Toyota KPI posts. I am following it closely and enjoy reading it. Excellent!
For the Q KPIs, I wonder, why do they use the FPY% and not the scrap%. Any ideas or explanations?
Thanks in advance.
Janez
Hello Janez, Scrap is part of the Cost KPI group. It can be argued if it is cost or quality, but the example I have lists it under cost. Will come soon in one of the next posts.
Hi Janez,
In situations when you do not have scrap but you can rework part it is not impacting your scrap KPI but you FPY KPI. You want to make them good from the first time.
That is why they use FPY, it is exposing much more deviations in our process than scrap KPI.
Best regards,
Aleksandar
Hello,
Nice. A defective part can have many defects. In FPY chart, is it not defective parts?
Hi Satish, the first pass yield shows the percentage of good parts.