
 This post in my series on the Toyota KPI dashboard looks at productivity. After safety and quality, this is the third-most-important KPI group on the Toyota dashboard. The cost is least important. This section of the dashboard measures different KPIs on the productive output of the system. Let’s have a look.
Introduction

Productivity can be measured in different ways. At Toyota, this is often using a couple of KPIs, although there may be differences between different plants. One measure is the labor time for the product, which is measured as the number of labor minutes needed per piece (operator minutes per piece). This is measured both monthly and daily. They also measure the operational availability. This is related but not identical to the OEE. The inventory also is relevant here. They also measure the line balance, but this is not what we would consider line balancing, but closer to the OEE. Finally, they also measure the output in pieces. This is one of the few KPI that are tracked on an hourly basis. Let’s dig deeper.
Operator Minutes per Piece
The first measurement is the labor time needed to produce one part. This is called operator minutes per piece. You simply take the number of operators, multiply it by the working hours of the shift (or actually the working minutes), and divide it by the number of pieces produced. This gives you how many labor minutes you need to make one piece. The sheet with the monthly data also shows the previous year as well as the target value. Please note that all data here is fictional and merely an example.

A similar sheet measures the daily values. There is no need to show the previous month average, as this is already on the monthly sheet.

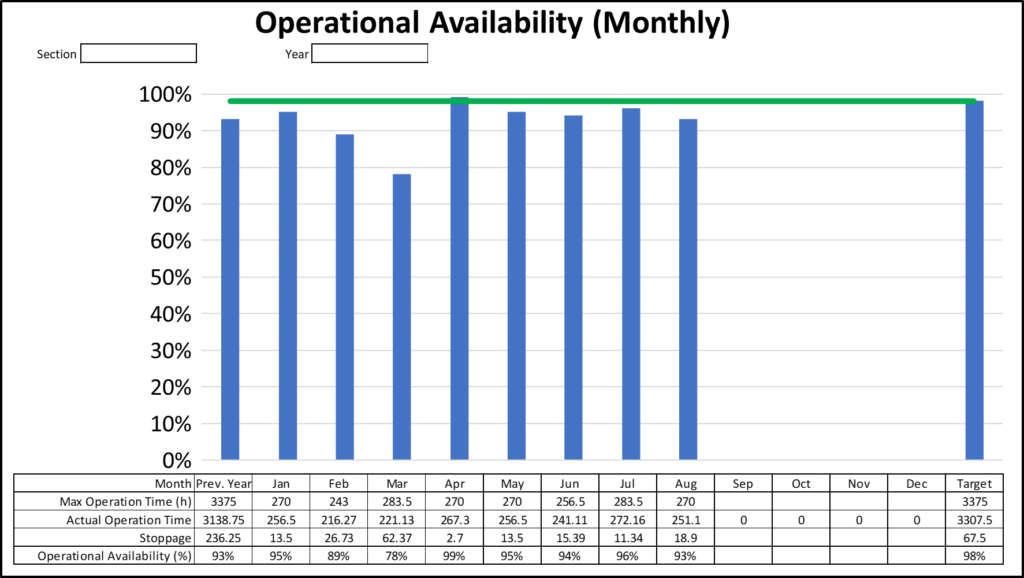
Operational Availability
The operational availability basically describes the uptime of the line—what percentage of the time the line is running properly. There are actually different ways to calculate this value at Toyota, depending if the line stops are recorded. If you do not measure the stops of the line, then the operational availability is calculated as follows:
\[ {Operational \; Availability \; (Percent) \; =}\] \[ {= \frac{Theoretical \; Operation \; Time \; (time)}{Actual \; Operation \; Time \; (Time)}}\]The theoretical operation time here is based on the number of pieces multiplied with the takt time to give the theoretical time needed to make the part. Please note while this looks somewhat like an OEE, the OEE multiplies the cycle time (without losses) with the number of pieces, where here we multiply the takt time (including losses) with the number of pieces.
A better way to calculate this, however, is to include the line stops. In this case the equation is as below.
\[ {Operational \; Availability \; (Percent) \;=}\] \[ {= \frac{Actual \; Operation \; Time \; (time) – \; Line \; Stoppage \; Time \; (Time)}{Actual \; Operation \; Time \; (time)}}\]The second equation is the “tougher” one, as it takes the line stops out of the percentage. However, this requires you to actually measure the line stops. Overall, the operational availability is similar to the availability losses when calculating an OEE. An example for the monthly data sheet is shown below, using fictional data.
The same sheet is also repeated for the daily KPI values on the operational availability.

Average Inventory Reach
The inventory reach shows simply how many hours the inventory lasts. Below is the example for the monthly and daily data.


Line Balance
The line balance may be a slightly confusing metric. You know line balancing as a way to distribute the work evenly across all workstations. On the KPI dashboard, this is simply the ratio of how many people you would need, in theory, to produce the output versus how many people you actually have. The theoretically needed manpower would be calculated as follows:
\[ {Theoretical \; Number\; of\; Operators\; (Operators) \; =}\] \[ {= \frac{Daily \; Demand \; (Quantity) \cdot Work \; per \; Piece\; (Operators \cdot Time/Quantity) }{Operation \; Time \; (Time)}}\]You take your daily demand and multiply it by the work needed to make one piece. This work would be the sum of all cycle times. Dividing this by the duration of the workday should give you the minimum number of operators. Let’s do an example. You work one shift of eight hours (or 480 min). The sum of all cycle times is 10 minutes’ worth of work. If you make 288 pieces in one day, then in theory you would need 10 [operator •min/piece] • 288 [pieces] /480 [min] = 6 operators. Now you simply divide the theoretical number of operators by the actual number of people you have on the line, then you get the line balance. In our example, if you actually had 8 operators on the line, then the line balance would be 6/8, or 75%.
\[ {Line \; Balance \; (Percent) \; = \frac{Theoretical \; Number\; of\; Operators\; (Operators) }{Actual \; Number\; of\; Operators\; (Operators) }}\]This is shown in a monthly chart including the previous years average and the target as shown below. A daily chart may be unnecessary.

Production Output
Finally, the last chart is tracking the production output. Unusual compared to all other charts, this is not a monthly or daily chart, but an hourly chart. The team leader or the group leader fills out the data by hand every hour. He adds the target quantity, the actual quantity, the gap, and, if necessary, problems that caused the gap and countermeasures to reduce the likelihood of the problem happening again. Below is such an example sheet.

Below is also an actual example from the Toyota UK Deeside engine plant fof the hourly quantity. Again, the sheets may look slightly different in different Toyota plants.
Overall, there is quite a lot of data on productivity. In my next post I will talk more about the KPIs on the dashboard related to cost. Now, go out, check your productivity, and organize your industry!
PS: Many thanks to Mikako Lenquist from C2U in Sweden for organizing the Lean Leadership System in Japan 2023, where former Toyota factory manager and director in charge of TPS promotion Akinori Hyodo shared his wisdom. Most of the data in this post series I learned from this tour.
Additional thanks to the team from the Toyota Lean Management Centre at the Toyota UK Deeside engine plant in Wales, where I participated in their 5-day course. This course gave us a lot of access to the Toyota shop floor, and we spent hours on the shop floor looking at processes. In my view, this the only generally accessible course by Toyota that gives such a level of shop floor involvement (albeit they want to open another center at the UK Burnaston final assembly plant).
Both the C2U Lean Leadership System course as well as the Toyota Lean Management Centre 5-day course are highly recommended!
Hi Christoph:
In the section “Operator Minutes per Piece,” does the counted time deduct scheduled breaks (breakfast, 5S) and/or unscheduled breaks (breakdowns, etc.) or does it take the total time of the shift (e.g., 8 hours)? And if there are several families (let’s say 8 different items) being produced, is it done for each individual family or for all of them combined?
hello Jose, i do not know for sure how this is done at Toyota. In my experience, either way is possible. i would exclude scheduled breaks, but include unscheduled breaks.
Hi Jose,
8 hours should be the full shopfloor open time (paid hours) where the Design time is 7.16h deducting all breaks during the shift. If you remove 5S, reporting, etc , any activities then you will come up with Useful time (net production time representing expected/targeted output). For me operators minutes per piece considers the useful time. About the line differentiation and in case the line is designed to run different types of products, again it depends on the cycle time, BOM, others. The UT is your lever.
Hello Chris!
I am interested in the Operational Availability (OA). The 2nd formula (the “tougher” one) looks to me the same as the Availability factor in standard OEE calculation. Are they really the same? I would assume not, but I cannot see the difference between them. Can you please explain it a bit more?
Thank you.
Janez
Hi Janez, this is correct, the operational availability is similar (or identical?) to the availability of the OEE. I added a comment to the blog posts, thanks for the input!
Hello Christopher,
the math for Operational Availability(Percent) and the chart doesn’t adup.
Chart equation OA%= (Theo. Op. Time – Stoppage) / Theo. Op. Time
eg. Chart: March 78% = (283,5 h-62,37h)/283,5h
If i use the second equation OA% = (Act. Op. Time – Stoppage) / Act. Op. Time = (221,13h-62,37h)/221,13h=71,8%
Greetings
Alex
Hi Alex….uh-oh…you are right. The calculation in my excel was that the actual time was the percentage of the max time. i.e. for march, 221.13 is 78% of 283.5, the difference being 62.37. my apologies, i messed up the labels for the rows in the excel chart. Thanks for finding that error!
Hello Christopher, may i ask when was this KPI’s implemented and how did it affect the productivity of the workers?
Hi NIel, not sure which KPI of these you mean, but the list is directly from Toyota. This does not mean that every plant does it this way, there is definitely some variation between plants, but it is used. Unfortunately, I don’t know the feelings of the workers on these KPI. I assume it depends a lot on how the managers use these KPI. I assume if they make the worker feel guilty, they would hate it.
Hi Christoph,
I just LOVE your blog. So many insights written in a clear, modest and witty way.
Not an English native speaker myself but I think “inventory reach” (for German Lagerreichweite?) may not be the correct term. I would go with Days of Inventory on Hand or Days in Inventory.
Happy holidays and talk to you soon,
Sven
Hi Sven, many thanks for the compliments. Indeed, “Days of inventory” is much more common than “inventory reach”. However, the latter also has 300 000 hits on Google. Or maybe it is just a covert infiltration by the German lean community trying to change proper English to the German style. Would not be the first time, “Just in Time” would be written properly as “Just on Time” 🙂
Cheers,
Chris