 Dashboards, in their many forms, are essential to track the performance of a production system. In this post I will talk more about the Toyota shop floor dashboard. A lot of the information is from Toyota in Japan, but the images are from Toyota UK. Keep in mind that the dashboards are not a rigid standard and there may be differences in how they are implemented in the different plants. For one thing, in Japan they are in Japanese, and in the UK in English, but there are also differences within the KPI itself. Let me tell you more in this short series on the Toyota KPI dashboards…
KPI
Key Performance Indicator – or KPI – are measurements regarding different shop floor performances.
Dos and Do Nots for KPIs
 A key part of managing your shop floor is understanding the current state of the shop floor. And KPIs are an important part of understanding the shop floor. But this is also not always easy. In my experience, the three most common pitfalls are to underestimate the effort (and hence the cost) of measuring a KPI, to overestimate the accuracy of a number, and (worst of all) to believe that the numbers tell you everything. Time for a reality check…
The Many Different Flavors of the OEE
 If imitation is the sincerest form of flattery, the OEE (Overall Equipment Effectiveness or Efficiency) is indeed one of the most appreciated measures in lean. I counted at least eight different variants and adaptions of the basic OEE – although let me tell you that I am not impressed with all of them. Many of them seem to be theoretical academic constructs with little meaning for your shop floor. Also, identical acronyms and similar terms are often used in a completely different way, adding quite a bit to the confusion. On top of that, I think the OEE is used way too much in industry where it does not make sense, and many OEE numbers are heavily fudged. Anyway, let me show you the many different flavors of the OEE.
Good and Bad Ways to Calculate the OEE
 There are different ways to calculate an OEE. I know of at least three different ways. However, some of them are easier and more practical than others.
Maybe you have seen a formula similar to OEE = A x P x Q. I see this formula often, but for me it is a very impractical way to calculate the OEE. Let me show you why by comparing the three different ways to calculate an OEE.
The A3 Report – Part 3: Limitations and Common Mistakes
 In the last two posts I showed you the basics of the A3 report and the (possible) content of the A3 report. In this last post of this series, I would like to talk about common mistakes and the limitations of the A3 report. Overall, for me the A3 report is a minor tool to help organize the real work of problem solving, despite all the fuzz some make about the A3 report.
The A3 Report – Part 2: Content

In my last post I wrote about four basic factors for an A3 report (one sheet / A3 size / with pencil / on the shop floor). This week I would like to show you what goes in an A3 report. The important framework here is PDCA (Plan, Do, Check, Act). However, in my view there is no single perfect A3 template that will fit all of your problems. Rather, an A3 is created on the go. Make the tool fit the problem, not the other way round!
The A3 Report – Part 1: Basics
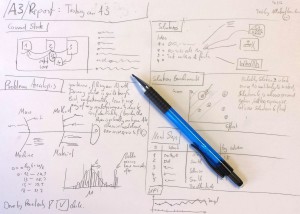
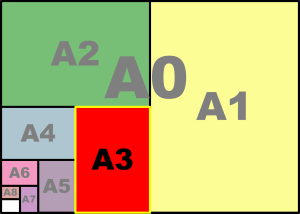
 If you know your way around lean, you surely have hear about the A3 report, famously named after the DIN-A3 paper size. It is also known as the A3 problem-solving sheet. The goal is to get all the necessary data on one sheet of A3 paper using pencil while you are on the shop floor. The A3 report is commonly used for problem solving, but also for project management or status reports.
What Is Your Production Capacity?
 Your production capacity is one important aspect of your production system. The capacity has to match your demand. If your demand is higher than your capacity, then you will not be able to supply the customer. On the other hand, if your capacity is higher than the demand, then you will have lots of idle workers and machines, which is not good either. The name is actually a bit of a misnomer, since capacity is the ability to contain things, whereas for a production system we are much more interested in the number of parts that are completed. In any case, capacity is important!
