
 In my previous posts I went into great detail through all the categories of the Toyota KPI dashboard: safety, quality, productivity, and cost. I also explained the additional section on HR development, albeit this may not really be KPI in the normal sense. However, the dashboard often contains even more: a section with the monthly production plan, a section for the allocation of the operator, and different A3s for improvement. Lets dig deeper:
Introduction
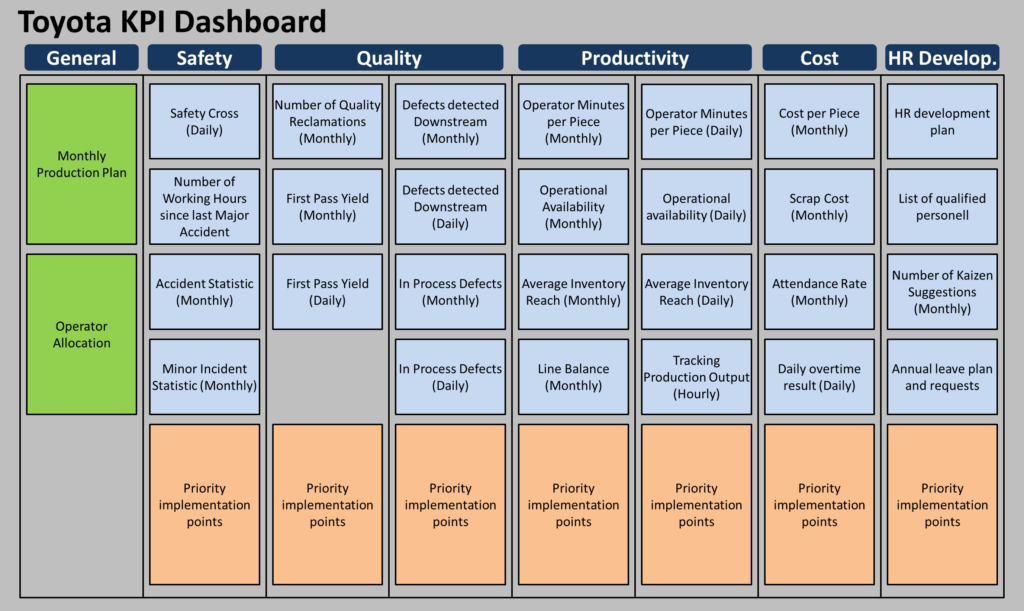
The Toyota KPI dashboard has a lot of KPI that are useful in managing production, related to safety, quality, productivity, and cost. In some cases, this is all you need. However, for the daily shop floor meeting there are a couple of organizational topics that are also relevant even though they are not really KPI. Besides the human resources section in my last post, there are organizational topics on what to produce (the production plan) and who is doing what (the worker allocation). Below is a schematic overview how this could look, although there are all kinds of different formats in use at different plants of Toyota.
Production Plan
One important part is the production plan. At Toyota this is often a monthly plan… which is usually impossible at most other plants. Toyota is extremely good at having a stable production plan. They level their production and then make the same quantity every day for one month. From one month to the next, the maximum allowed change is ±10% (barring extreme events like a supplier plant burning down). And (while not perfect) they are very good at sticking with this plan. In quite a few plants all over the world, including suppliers close to Toyota, I have seen production plans that looked like this, where every day has exactly the same quantity (exceptions only for weekends and public holiday, etc.)
- 1st Day of the Month: 743 Parts
- 2ndDay of the Month: 743 Parts
- 3rd Day of the Month: 743 Parts
- …
- 30th Day of the Month: 743 Parts
- 31st Day of the Month: 743 Parts
I have seen many other plants trying to do the same, or even trying to have a two-week plan… and fail miserably. Most plants I have seen cannot even produce reliably for the next three days what they are planning now, let alone for a month! I have seen over and over again that forcing a two- or four-week production plan on a plant that lacks stability and also lacks the needed buffer to decouple fluctuations just ends in misery for all involved. The plant tries to force the long-term plan despite problems with suppliers and changes in the customer demand, making it even worse than if they merely adapted the plan on shorter notice. As such, it is my STRONG recommendation not to try such a two- or four-week plan unless you have stability like Toyota. If you are unsure if your stability is like Toyota, then I can tell you IT IS NOT!
Operator Allocation
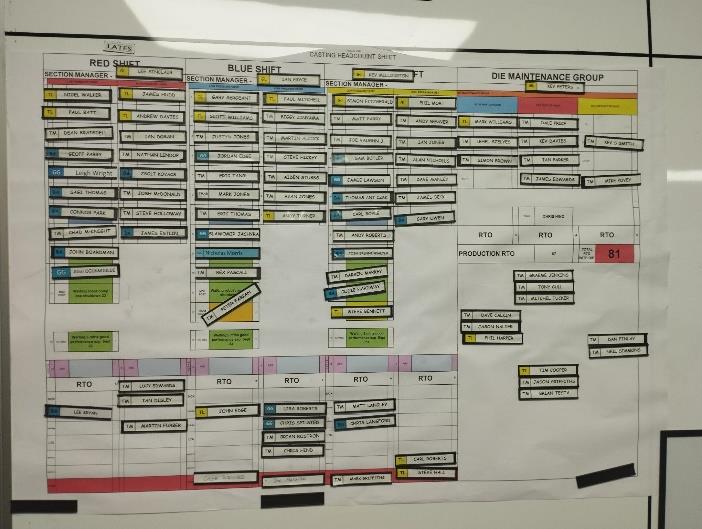
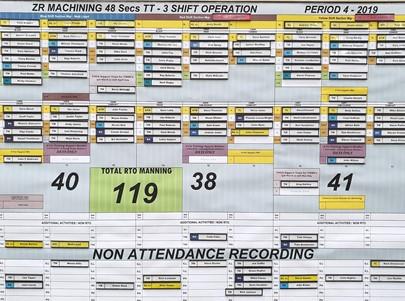
Part of the planning of a shop floor is to determine which people are assigned to which machines. This is done on a daily basis. Below are a couple of examples from the Toyota UK Deeside engine plant. Toyota usually uses magnetic stickers with the names of the employees (and sometimes also a photo). Using such magnetic cards makes it very easy to arrange and it can be done quickly. The magnets are often arranged on a (schematic) layout of the shop floor, where the work positions are indicated, as shown on the first example below. It could also be merely a grouping for different areas, as the second two examples. All examples below show three shifts (the red shift, the blue shift, and the yellow shift), which rotate between morning, afternoon, and night shifts. The last example also shows a (still somewhat uncommon) digital board for such an arrangement, but it is clearly visible that this was inspired by the magnet label type of board.

A3s
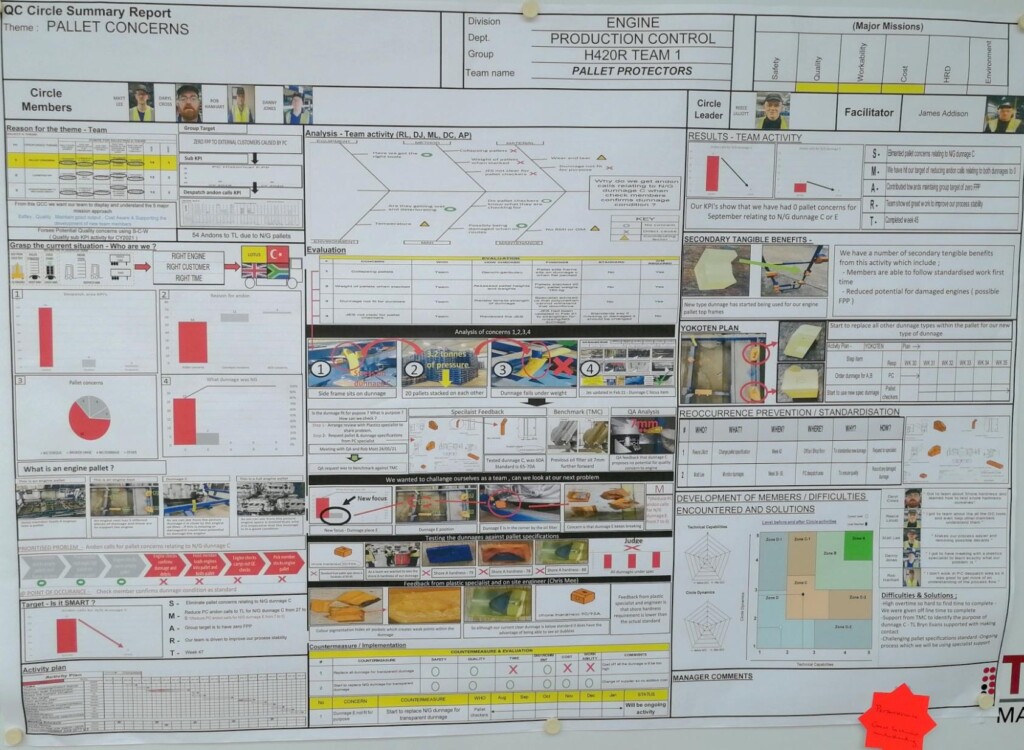
Such shop floor dashboards also often include one or more A3 sheets. Below is a closeup of one A3 from the Toyota UK Deeside engine plant. It follows the overall structure of the PDCA, and also the structure of Toyota problem-solving (more in a later post). It states the reason for the A3, a detailed analysis of the current situation, and a target (including a description why). Next the problem is analyzed in detail (you can see a fishbone diagram included), and different solutions are considered. The implementation of the countermeasures is also tracked. Most importantly, it checks if the implementation actually works by tracking the target KPI. It also includes a section on the lessons learned that could be helpful for other plants. Toyota actually has an internal database that shares such problems and solutions with other plants.
Below is an example of multiple such A3s on one dashboard for the Toyota UK Deeside engine plant casting department. There is one A3 for every shift (red, blue, yellow) and section (melting, high-pressure casting, low-pressure casting, and low-pressure finishing). While the example above is a completed A3 sheet, the examples below are in different stages of completion, between just started and tracking results.

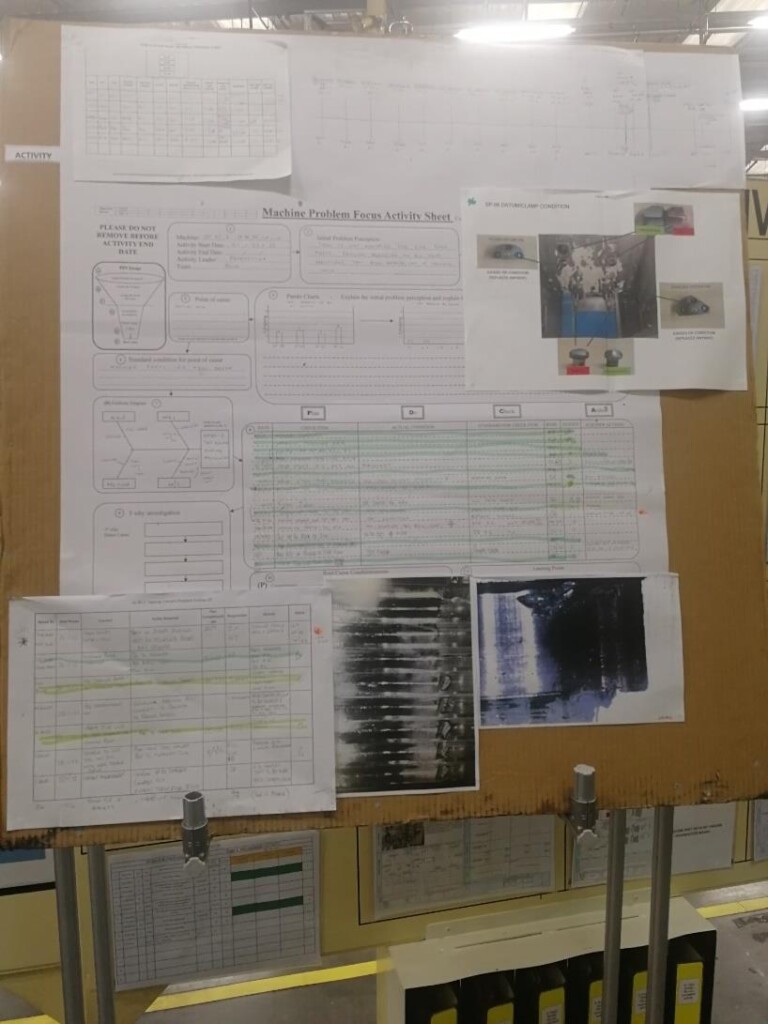
Such problem analyses are also often done with pencil. Below is another example from Deeside, trying to analyze some machine problems.
Other Dashboard Elements
The dashboard KPI presented in the previous posts are the most important ones. However, sometimes there are more. Toyota is somewhat hesitant to dive headfirst into untested digital waters and often prefers paper, but even at Toyota there is slowly more digitization. Below is an example of such a digital dashboard, showing the details of the breakdown analysis at the Toyota UK Deeside engine plant. More dashboards (e.g., for scrap) are also available. While there is a lot more data available, it is important not to get lost in the details. If you want to look at all available data every day, the day is over before you get around to do anything.

This completes my series of blog posts on the Toyota KPI dashboard and related elements for the shop floor meeting that happens daily or for every shift. Now, go out, track and solve your problems, and organize your industry!
PS: Many thanks to Mikako Lenquist from C2U in Sweden for organizing the Lean Leadership System in Japan 2023, where former Toyota factory manager and director in charge of TPS promotion Akinori Hyodo shared his wisdom. Most of the data in this post series I learned from this tour.
Additional thanks to the team from the Toyota Lean Management Centre at the Toyota UK Deeside engine plant in Wales, where I participated in their 5-day course. This course gave us a lot of access to the Toyota shop floor, and we spent hours on the shop floor looking at processes. In my view, this the only generally accessible course by Toyota that gives such a level of shop floor involvement (albeit they want to open another center at the UK Burnaston final assembly plant).
Both the C2U Lean Leadership System course as well as the Toyota Lean Management Centre 5-day course are highly recommended!
Thank you, Chris!
Excellent series of posts!
Hallo Herr Roser,
auch ich muss sagen eine sehr gute Reihe von Beiträgen die auch sauber dargestellt und vermittelt wurden.
Eine unbekannte ist mir aber noch offen, und diese ist: “Wie schafft Toyota diese Nivillierung der Produktion. In meiner beratenden Tätigkeit in der Prozessoptimierung kam sehr oft das Feedback:
– Das geht in unserer Branche nicht
– Sowas ist nur im Automobilbereich möglich
– usw.
Ich persönlich sehe es anders, da man schließlich auf Vergangenheitswerte zurückgreifen kann und ja auch mit Wachstum eines Unternehmens plant.
Vielleicht haben Sie oder können zu diesem Thema noch einen zukünftigen Beitrag erstellen.
Vielen Dank
Hello Jan (switching to English so everybody can understand)
thanks for the compliments. There re different types of leveling. Mixing the volume in small lot sizes is easier. But (what many consider leveling) things like a two week pattern or so is devilish hard. I usually strongly recommend against this type of leveling, as it requires a very high stability of the production, which is usually not there. See my post series on leveling.
Cheers,
Chris
Lieber Christoph – vielen Dank für die Artikel-Serie, die sehr hohes Interesse in meinen Lean-Trainings geweckt hat! Sehr anschauliche Eindrücke und Darstellung. Daher mein Wunsch in deinen Worten: Now, go out, write many more such informative articles, and organize your industry!
Viele Grüße,
Thorsten Speil
Hello Thorsten
“…Now, go out, write many more such informative articles, and organize your industry!..:”
Will do 🙂