
One of the many different ways to visualize a value stream on paper is a bubble diagram. While not quite as prominent as value stream mapping, it does help you in the design of a new line. Bubble diagrams are used in many different contexts, but here I will explain their use for lean manufacturing.
What Are Material Flow Bubble Diagrams?
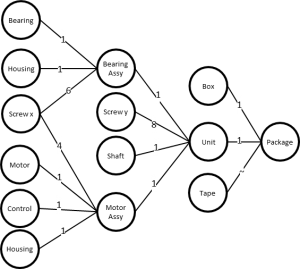 Bubble diagrams show you the material flow in detail, but do not go into details of the information flow. As such, they are faster to make and can show a larger number of material flows simultaneously.
How to Make a Material Flow Bubble Diagram
There are two different versions of a material flow bubble diagram.
Material Bubbles Only
In this version of the bubble diagram, there is one bubble for each part. If you’re using a MRP system, you could simply get all part numbers associated with the product by looking up the bill of materials (BOM). Each part has its own bubble – or any other shape, since it is not really a standardized approach. Hence, if you prefer a box or an oval, go for it. You could even distinguish purchased components and manufactured components by color or the shape of the bubble.
Step 1
 In this example, I used green for the completed product, yellow for pre-assemblies, and blue for purchased parts, which works if you do it in digital form. If you do it using pen and paper (preferred), it may be easier to use different shapes for boxes. I usually start with the final part on the right side of the paper and add all items on the bill of material as bubbles immediately to the left.
Step 2
 In the next step, I add the number of parts required on the connecting lines. In this example, we need one box, one unit, and an unspecified amount of packing tape to assemble one package.
Step 3
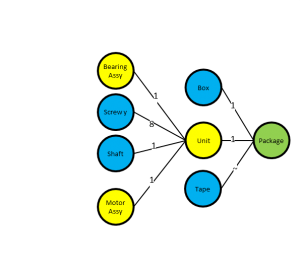 The box and the tape are purchased components. The unit, however, is a product manufactured within the system we are looking at. Hence, it also has a bill of material. I repeat the step using the bill of material for the unit, which itself consists of four different parts that it will need between one and eight times.
Step 4
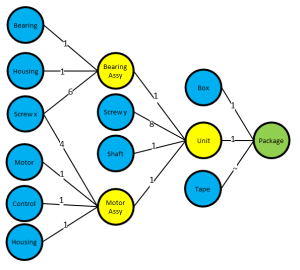 The bearing assembly and the motor assembly are also produced within the scope of the line under investigation. Hence, again I add the bill of materials until only purchased components or components from outside of the investigated manufacturing system are left.
This version of the bubble diagram includes only parts. It has no information on the processes needed to manufacture them. Hence it is a very easy-to-make diagram.
Material and Processes
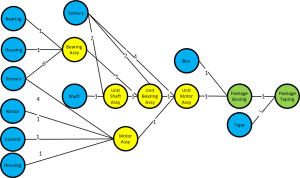
A second option is to include processes in the bubble diagram. In many cases the result would look the same, as often a part gets a new part number after each process. However, if there is a sequence of processes having the same part number, it may be helpful to include the processes.
The process is very similar, except now a produced part can have multiple bubbles if the production is spread across different processes. Overall, this gives you a good picture of which parts are needed at which processes.
Additional Variants
There are many additional variations possible. First and foremost, a bubble diagram should help you in solving a problem. You add whatever is necessary to help you, and leave out whatever is not.
For example, you could add the part numbers into the diagram. This may reference the part more clearly than a simple verbal description. You can also leave out the number of parts needed for each manufactured part if you don’t need them.
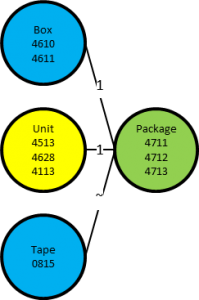
If you produce more than one variant of a final product, chances are that you have at least some parts that differ between variants. A variant may need more parts, different parts, or less parts than another variant. This can also be added to the bubble diagram. You could add extra bubbles for variants, or add additional part numbers within a bubble if there are different types needed for different products.
For example, the image on the left has three different finished goods. They all use the same tape, but have two different boxes and three different units. This way you can keep track of the needs of the different products manufactured in your production.
You could also use different shapes (circles, squares, diamonds …) and colors, different lines, etc. You can use post-its on a whiteboard, write it on paper, and so on. The possibilities are almost endless. This of course also includes the risk of overdoing it, and getting lost in a mess of formats and styles. As always, fit the tool to your needs!
When to Make a Material Flow Bubble Diagram
A bubble diagram can give you an overview of the material flow for a line or site. You could also use a value stream map, but if you have many parts this will quickly overwhelm you with the details for the information flow. Sooner or later you may have to do a value stream map for all parts, but not necessarily on the same sheet of paper. Hence, a bubble diagram is easier than a value stream map.
Going in the other direction, you could also simply look at the different bills of material. However, this would be a pretty big data set, which I find easier to understand if it is represented in graphic form. This bubble diagram is pretty much a bill of material in the form of a diagram.
Hence a bubble diagram may help you keep track of all the parts needed for your assembly. I find that a value stream usually looks only at some important key parts. However, you need all parts to make a product, not only the “important” ones. This tool helps you not forget any parts in your design and layout of your manufacturing area.

Granted, the above tool is not a groundbreaking new innovation that will change your life. Even if a consultant invents a fancy Japanese name for it, he would be hard pressed to sell it to his clients as a novelty – but then I have been sometimes surprised by what kind of ordinary common sense things are sold as exciting and expensive novelties in lean manufacturing 🙁 .
However, even though it is a small tool, I find it helpful when designing a value stream. As such, I hope it helps you too when you go out and organize your industry!
