
One frequent and tricky question when designing a pull system is to determine how many kanbans to use in the system. There are two possible approaches. First, you can calculate the number of kanbans using a kanban formula. Due to the length of the process, I have broken this into two posts (For the second part click here). Alternatively, you can estimate the number of kanbans and adjust the system as it is running (as shown in a third post).
Kanban Calculation Fundamentals
The number of kanbans defines the performance of a pull system. If you use too few, you will have constant problems with interruptions and missed deliveries or idle workers and processes. If you use too many, you waste space and money for inventory. Of course, if you have the choice between missed deliveries/idle workers or two more parts on the shop floor, I would go for two more parts. Hence in kanban calculations, it is customary to err on the conservative side and, in case of doubt, use more kanbans.
Factors Influencing the Calculation
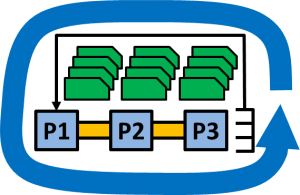
Overall, there are five factors that determine the number of kanbans in a system. The first four are rational and are shown in the picture below. The fifth one is not very rational, but it is still needed for the system to work smoothly. These five factors, in the order we will cover them below, are:
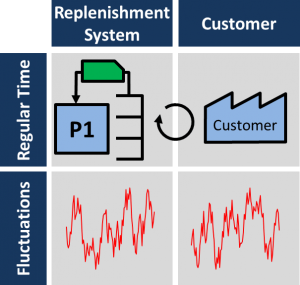
- Regular Time of Customer: How many parts does the customer need in a certain period?
- Regular Time of Replenishment System: How long does it take to replenish a product in your production or supply system?
- Fluctuations of Replenishment System: If there are problems in the replenishment system, what problems do we want to cover?
- Fluctuations of Customer: If the customer orders more quantity, or the same overall quantity but less frequently, which fluctuations do we want to cover?
- Safety Margin: Do we want to add additional kanbans so personnel feels more comfortable with the system?
The first two factors will be explained in detail below. The other three factors will be described in the second part of this series of posts on Kanban calculation.
Of course, a major underlying assumption for the kanban calculation is that the system can deliver parts faster than the customer needs them. If your system is too slow, no amount of kanbans will increase your delivery performance. A second assumption is that raw materials for the kanban system are always available.
Precision of the Kanban Calculation

Kanban formula, kanban calculation … it sounds like physics or science, it all sounds so precise. But let me be very clear on one point: It is not precise! The kanban calculation is nothing more than a very rough estimate using many assumptions. Slightly different but equally valid assumptions may easily change the result by 30% or more. I will point out the assumptions and their effects below to show you the level of precision of the kanban formula.
Kanban Calculation – Part 1
Below are the mathematical calculations (estimations!) to determine the number of kanbans. Important: You need to calculate this separately for every product type that you want to put in your kanban stock! Do not calculate this only once for the sum of all product types and then split the kanbans according to volume of the product types. This will not work!
1. Regular Time of Customer – Customer Takt

The demand on our kanban system is set by customer demand. The average time between parts ordered by the customer is the basis for converting delays in the system into needed kanbans. We need the so-called customer takt (where takt comes from German and means tact, pulse, or timing). If you have multiple kanban loops in sequence, always take the final customer of the system, not only the demand by the next loop.
To calculate the customer takt, you first need to decide which time period you want to look at. This could be, for example, a week or a month. Then you need to estimate the working hours of your system during this time period. Next you need to estimate the total number of parts delivered to the customer in the future during this time period. The customer takt is now simply the total available working hours of your system divided by the total customer demand during that period. Now you have the average time between the demand for a single product (i.e., your customer takt).
For example, say you decide that you want to look at the next four weeks. During these four weeks, you work five days per week with two shifts of seven hours each. Hence in total you have 280 work hours available during the next four weeks, or 1,008,000 seconds (4 weeks x 5 days x 2 shifts x 7 hours; with 3600 seconds per hour).
You estimate that the future demand by your customer during the next four weeks is 36,000 parts. Dividing your 1,008,000 seconds by 36,000 parts gives you a customer takt of 28 seconds per part. Hence, on average your customer will order one part every 28 seconds.
I mentioned above that the kanban calculation is a very rough estimate. We already have some uncertainty here. Will your system really work 280 hours, or will there be a meeting, a strike, overtime, a day off, or some other interruption? Also, for your customer demand, will the customer really order 36,000 parts? Or will it be more parts due to your customer running out of stock, or less parts if your customers’s demand goes down? All this adds uncertainty. My advice is to make a good estimate, but don’t overdo it. There are much more fuzzy things to come below.
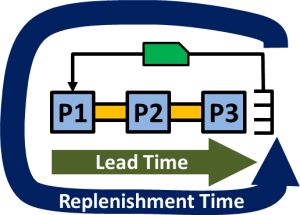
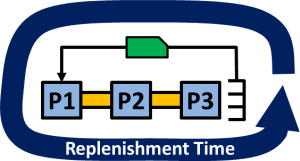
2. Regular Time of Replenishment System – Replenishment Time
Next we look at the time needed for one kanban to make a complete circle. If a part is taken out of the supermarket, the kanban is sent back for replenishment. The time between the kanban leaving the supermarket and the kanban coming back to the supermarket attached to a part is hence known as the replenishment time. For our kanban calculations, this replenishment time is needed to estimate the number of kanbans to supply the customer while the supermarket is restocked.
One important part of this replenishment time is the time from the beginning of the actual processing at the first process until the part with the kanban comes back to the supermarket. This time is known as the lead time. For easier understanding, we start our calculations by determining the lead time (i.e., the time for the material flow).
2.1 Lead Time
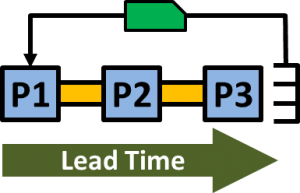 The lead time can be calculated rather straightforwardly using Little’s Law. Little’s Law, named after its discoverer, John Little, determines (for our purposes) the lead time based on the number of parts in the system and the speed the parts are leaving the system. The law is quite simple, rather precise, and in my view very beautiful.
For example, if you have an inventory of 100 parts in the system and the throughput states that there are 10 parts leaving per hour, then the total lead time is 10 hours (100 parts divided by 10 parts per hour). A good example is waiting in a supermarket line. If there are ten people in front of you and on average the check out staff serves two people per minute, then you will have to wait five minutes.
The law is widely valid and quite precise. Unfortunately, the imprecision comes from getting the data, which adds more fluffiness to our very rough estimate. What number to use for the parts in your system? Of course, you can count them now, but will this still be valid tomorrow? With respect for kanban calculations, I recommend a conservative approach. Take the maximum number of parts that fit in your system (i.e., assume all your FiFo lanes are full and all your machines are loaded to capacity). It may or may not happen, but you still want your kanban system to work when it happens.
Secondly, how fast are your parts leaving the system? Here again you could use different numbers. You could use the inverse of slowest cycle time, or the long-term average throughput, etc. I usually use the long-term average throughput or the inverse of the customer takt (which should be similar anyway). In this way I have also already included fluctuations and losses in the system.
Additionally, you must not forget changeover times. If a kanban arrives at the first process and then has to wait for the set-up (changeover) of the first process, then this time has to be added to the lead time too. If multiple processes in serial or parallel order have changeover time, you have to keep an eye out for overlaps. How much does the lead time increase in total due to changeover times?
Of course, if your lead time includes delays for bulk processing or shipment, you have to take this into account too. For example, if your kanban loop includes shipping from China, then the ship takes two months including customs, no matter how many parts are on the ship. In this case, the lead time would be two months.
2.2 Replenishment Time
 The replenishment time now consists of both the time of the material flow (the lead time) and the time for the information flow. Since we just calculated (estimated!) the lead time, we now merely have to determine the time for the kanban from the supermarket to the start of production.
The first part is the waiting time of the kanban at the supermarket after the part has been taken out and the physical movement of the kanban. For example, if every hour a team leader brings the kanban from the collection box at the supermarket to the production, the average waiting time of a kanban at the supermarket would be 30 minutes. However, kanbans can wait up to 60 minutes if a part was taken out of the supermarket just after the team leader collected the cards. Nevertheless, the kanban system still has to work. Hence we assume here the time between pickups as the waiting time at the supermarket.
Secondly, a lot size for production may not only be one kanban but multiple kanbans. For example, if production starts only for a lot size with multiple kanbans, the first kanban has to wait for the remaining kanbans of the lot until a lot is complete and it can be processed. While the average waiting time is shorter, the maximum waiting time is the lot size in kanban minus one. Using a conservative approach, we hence take the maximum waiting time. if your lot size is 10, the waiting time is 9 kanbans; if your lot size is 25, the waiting time is 24 kanbans; and so on. We could now convert the number of kanbans into waiting time, but later on we want to convert the time back into kanbans. Hence, here we keep the waiting time in kanbans to add them later to the kanban total.
Finally, a lot size may not be processed immediately. There already may be other lots waiting for processing before a kanban in the latest lot gets its turn. This is usually a major part of the replenishment time. Unfortunately, this is also very hard to estimate. I have emphasized above that the kanban calculation is only a very rough estimate. This part here is the kicker in terms of imprecision. The waiting time for other lots can fluctuate wildly. What I usually do is assume that for every high-runner product, one lot size (which may be multiple kanbans) is waiting in front of the latest lot.
For example, assume you have 10 types of product, 5 of which are frequent high runners, and each of them has a lot size of 4. In this case, the latest lot may wait for 4 other lot sizes representing 16 kanbans (if it is a high runner too), or 5 other lot sizes representing 20 kanbans (if it is a less frequent exotic part). But again, this is only the roughest of the very rough estimate. Here +/- 30% are easily possible depending on your assumptions. Determining all other factors (customer takt, parts in line, time between parts, etc.) in high precision is a waste since this estimate negates all this precision. It is almost impossible to get precise data here, but you can’t ignore it since it is a big part of the kanban loop.
As for the lot size above, the waiting time for other lots can be expressed in kanbans, which we could now convert into time just to convert them back later into kanbans. However, my preference is to keep these as kanbans and merely add them to the total later.
In the second post on kanban calculation, I will describe how to include the fluctuations of both our own system and the system on the customer side, before tallying it up and adding the safety margins. The final post will then describe a different approach using kanban estimation and maintenance of the number of kanbans.
How to define the factory (example garment) need to uses kanban or not? Thanks you!
Hello Giang
kanban is one option to make a pull production (another option would be CONWIP). For almost all cases, including garment manufacturing, pull production is superior to push production. Having an upper limit on the WIP gives much better production performance.
Hope this helps,
Chris
Hi Giang, this may help (a method we have developed to answer ‘how do you know when to kanban?’)
To identify potential Kanban candidates based upon the three elements (Average demand, Order frequency, Stability of demand), an empirically tested method has been developed:
A part is a candidate for Kanban if all 3 criteria are met:
1. Average weekly demand is over 60 parts per week.
2. Order frequency is over 80%.
3. Demand is stable – One Standard Deviation is less than 100% of average demand.
The figure of 60 parts per week was chosen as a minimum quantity based on the type of components, processes and volumes involved in this particular product range.
Order frequency over 80% means the part was delivered to the customer (in any quantity) during at least 80% of the weeks sampled.
Demand is deemed stable if one standard deviation is less than the average demand value per week (σ < Av weekly demand).
This evaluation has been semi automated into a spreadsheet, drop me a mail and I will send you the 'how to' or check out e-book at
Kanban – Authorising The Flow
Paul.
Hi Paul, these numbers seem reasonable for larger parts (Cars, machines, …). Be careful, however, if you produce different products as for example standard screws. 60 screws per week is not much. Personally I also think it depends on the system, in particular its replenishment time, and also the customers willingness to wait. If you can produce everything from scratch while the customer waits, make-to-order using a CONWIP system is the way to go.
Hello!
Is it a mistake in the point 2.1 that lead time is a multiplication of inventory (L) and average time between parts (lambda)? According to “A Eulogy for Little’s Law” it should be the quotient…
Regards
Hello Małgorzata. Darn, you’re right. Both equations are correct, but throughput is usually defined as parts per time, whereas above I defined it as time per parts, which would be a takt. Using my definition above the equation is correct, but using the “normal” definition of throughput It of course has to be divided by the throughput. Thanks for pointing that out, I have adjusted the post above and now use throughput as parts per time.
If you have kanban it means that you don´t have your process connected and you need the tool to balance. Kanban is reflex of a problem!
Safety Margin as defined above sounds like permission for a non-formulaic addition of kanban signals. In my experience I expect an acceptable level of kanban failure – or 95% confidence, as it is exponentially more expensive as you approach 100%. Instead of allowing the system to accept these “safety” kanbans, the system failure should be used as an opportunity to become better with 5-why or other problem solving tools. Many times kanban failure is a sign of a healthy kanban system. Furthermore, supermarkets and the related use of kanban should be a temporary solution on the road to further waste elimination. Supermarkets are always sign of kaizan opportunity. What would Taiichi Ohno advise here?
Hi Chris, that is exactly what it is – a feel-good factor for the shop floor. I know that tightening the number of kanban helps to find problems on the shop floor. However, in my experience most western shop floors don’t need this help – the problems come all by themselves. Toyota has a) much fewer problems and b) much more manpower for fixing, hence, they can work these problems. In the west, it feels like a constant firefighting with short term fixes because there are too many problems and not enough people. In this case, I rather have enough kanbans so there are not even more problems that I have no time for.
The effect required is “smoother and faster flow”. The Ultimate goal is to remove as many kanbans without flow penalty, and move to “MTO”. Kanbans smooth the flow, they provide a buffer between processes. i use 3,6,9 tickets in a kanban. i like thirds. I don’t get to bothered by the start number of parts in a kanban. it sorts itself out quickly. i use kanbans where there are fast runners to medium runners, otherwise, MTO.
Hi,
Actually we have below part no’s from production to supermarket
part no Deaily demand Lead time for 10 batch
A 2 5.5 hrs
B 4 5.5 hrs
C 4 5.5 hrs
D 4 5.5 hrs
E 17 5.5 hrs
F 5 5.5 hrs
G 1 5.5 hrs
H 1 5.5 hrs
I 13 5.5 hrs
J 5 5.5 hrs
K 16 5.5 hrs
L 17 5.5 hrs
I wanted to know the details of the Kanban and Heijunka calculation for the above