

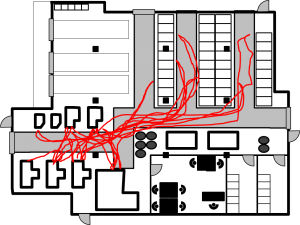
A spaghetti diagram is a quick and easy way to track distances of parts and people on the shop floor. The name comes from the result looking like a plate of spaghetti. In this post I will explain the details and give some tips and tricks on how to make a good spaghetti diagram.
Why Do I Need a Spaghetti Diagram?
A spaghetti diagram, also known as spaghetti chart, spaghetti model, or spaghetti plot, is a particular tool for determining the distance traveled by (usually) man or (in some cases) material. Hence, a spaghetti diagram can help you if you want to reduce the distance traveled by either parts or people. Obviously, this works best for an repetitive environment where the work repeats in the same or similar style multiple times.
This allows you to then analyze and optimize the distances. The benefit can be either faster delivery or the same delivery with less effort.
How to Make a Spaghetti Diagram
Spaghetti Diagram for a Person
Spaghetti diagrams are most useful for determining the route a person has traveled by either walking or driving (e.g., with a forklift). It even works for automated guided vehicles (AGVs), even though, in lean wisdom, waiting times of people are much worse than waiting times of machines. All you need is a layout, a pen, someone observing, and someone observed. Other lean sources also suggest a stopwatch and a measuring wheel, although I am usually fine with my normal watch and a distance estimate.
Naturally, you should inform and, if necessary, get consensus of the people observed and possibly the works council or union representatives.
Whom to observe depends on the question and scope of the problem you want to solve. If you are worried about the efficiency of a machine operator and noticed that his task includes some walking, you may observe a typical machine operator for these machines. On the other hand, if you are more interested in optimizing the material transport, then you should look at one of the people transporting goods. In sum, observe the work of people that you want to optimize.
During a typical work day, meet with that person and follow him around on his normal work. When you start, note the start time on the diagram. While he walks through the factory, mark his route with a pen on a layout of the factory. I usually use a colored pen on an ideally not colored layout (just use a gray-scale printer). You can also add arrows to indicate directions. Whenever I observe him doing something worth remembering, as, for example, searching, making mistakes, or doing other types of waste, I also make a quick note on the layout. This can also include times and will come in handy later on for the improvement. Do not skip any parts, even if it becomes messy (unless the worker needs a toilet break).

Theoretically, you could follow the worker all day long. Practically, this is usually a waste of time. Besides, the worker usually doesn’t want you to record his toilet break. There is no fixed rule for the duration of a spaghetti diagram. I usually observe long enough that I feel I have understood the situation and then add a little more time to see if something unexpected happens. However, even for highly cyclical work, following only one round is definitely not enough!
After you complete the observation, write down the end time so you have the interval observed. If you take breaks, note the start and end of the breaks. Congratulations, you have completed a spaghetti diagram.
Spaghetti Diagram for a Part
Similar to following a person, you can also follow a part. This makes most sense if you have a job shop. If you have a flow shop, you will end up with something like a straight line. Just follow the part from the inbound warehouse to the outbound warehouse (or whichever area you are interested in).

When following people, you have the advantage that they usually don’t like to wait. Hence, with people you will see a lot of action. Parts, on the other hand, don’t mind waiting. In fact, parts usually wait quite a long time in manufacturing. It would be a waste of time to wait along the part until it is needed often days later.
There are two ways out of this. You could either follow the next similar part that leaves the inventory. It won’t be exactly the same part, but it is the same part type. The resulting diagram will likely be the same, but with much less effort.
Another option is to simply look up where the part would go next based on the production plan. Hence you would create a spaghetti diagram based on available data. In theory, you could make the diagram while never leaving your desk. That is risky. Being on the shop floor gives you much more information than what is in the official data set. In the computer data, you will rarely see all the problems, confusions, mix-ups, and other issues that you could improve. Hence, following the data train instead of the physical part is only a last resort – for example, if you track shipments across a world map.
In any case, following the people doing the work is usually much more interesting than following the parts that are worked on. After all, since you want to improve the work, it is much better to observe it directly than to guess the work based on the path of a part! Overall, a spaghetti diagram is, even more than other lean projects, a pen-on-paper exercise!
Spaghetti Diagram for Multiple People or Parts

You can also take a diagram for multiple people or parts. Besides taking separate diagrams, you could also use the same diagram and add different colors. In this case make sure you use a thin pen, or you may not see much anymore afterward.
Except for following multiple people (or parts), the result will pretty much be the same.
What to Do After You Have the Diagram
Analyze Status
Please note that the spaghetti diagram is, by itself, not an optimization method. It only gives you the current state data of the distances. What you do with the data afterward will make the difference. To analyze the situation, it is often helpful to estimate the total distance walked.
You can simply do a rough estimate of the distance walked by taking the distances on the layout and multiplying it by the number of times they were walked (counting back and forth separately, of course).
Another option is to use a step counter, also known as pedometer. Simply give the worker a step counter, reset it at the beginning and note down the steps at the end. An average step is around 2.5 feet or 70 cm long. The average walking speed is 3.1 miles or 5.0 kilometer per hour if you also want to calculate the time needed for walking.
You can also get the current state for a larger number of workers simultaneously by distributing multiple step counters. While you do not get the exact routes, you will get the distances walked. This is very useful for a before-and-after comparison. For larger projects, I simply get a box of 10 or 20 simple step counters for little money, which the workers can have afterward as a gift.
Improve Situation
The real money in the whole exercise is of course in improving the situation. Everything up till now only helped you understand the current state. While there is, to my knowledge, no strict formal method, there are lots of common sense ideas. Most of the time common sense is all you need anyway. You should also definitely ask the people doing the work; they often have quite a lot of common sense and can give you lots of ideas. You could do any of the following:
- Move parts closer to where they are needed.
- Arrange machines and processes to be more in sequence or at least closer to each other (make sure that while you are improving one workload or part, you are not making it worse for all others).
- Simplify processes. For example, rather than searching for a part on a shelf, have the part location printed on the request paper (sounds obvious, but saved a lot of time in a project of one of my employees).
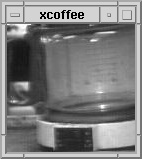
- Determine if you can do it electronically. Walking across the plant just to look something up is a waste of time. For example, the first webcam was installed at the University of Cambridge simply to inform others if there is still coffee in the coffee pot. I also had great success with changing an manual valve two floors below the control room with an electrically operated valve.
- Determine if you arrange it in a better sequence. Don’t be like the roofer that goes down to pick up every tool he forgot.
- Determine if you have to do it at all. Can it be automated? Can it be eliminated?
- Distribute the workload differently to reduce walking times.
- Reduce errors, searches, waiting, and other interruptions of the normal work flow.
- Determine if you can use any type of visual management to make the process faster or more reliable.
All of the above can help you reduce the overall distance traveled and the total time needed to do the work. Please note that reducing the distance is one thing, but with this observation you also have the possibility of reducing waiting times and working times, which will also benefit the overall bottom line.
Verify if New Status Is an Improvement
After you have implemented improvements, definitely do another spaghetti diagram or step counter measurement to see if you made a difference. This would be the “check” of the Plan-Do-Check-Act (PDCA) cycle. Nothing pleases management more than if you can tell them how many dollars you’ve saved them.

Spaghetti diagrams originated in manufacturing, but are now used in many other areas, too, from studying butterflies to following weather buoys.
Well, all this writing about spaghetti has made me hungry. I need to check if we have spaghetti in the kitchen. So, while I eat some spaghetti, you can think about how spaghetti diagrams can help you organize your industry!
many thanks for the nice article…
regarding the point of following the worker i really like your practical approach …i did something a little different as i put the camera on the top of the working place and i follow him with a handy cam if he happen to go out of site then i make a 5 minute meeting with him to ask about the things i don’t understand.
Thanks for the kind words, Mohamed. About using a camera: Make sure this is cleared with the worker and if necessary the works council beforehand. In many countries the worker would be against using the camera. If it is forced upon them, then they will (for spaghetti diagrams literally) lead you astray. The camera has some benefits, but in the countries I usually work in the hassle is usually not worth the benefits. Yet, if it works for you, go for it.
Hello Mr. Roser,
great article.
I do the spaghetti and standard work observation all time with video help, then i can check the way, work in a easy way and short time. Also I can check it after days again.
You must ask the employees and the work council before, but this is no problem after several time doing and knowing the results of these methodic.
But the important thing is, just do it, or “go to Gemba”, you must go into the production area and use the time for observation. Very often I heard that we have no time to do this observation, but this is the wrong way. The guys found 100 reasons why they have no time, but they don’t search for a reason for time.
After a good observation you have a lot of ideas for changing.
Now I will go into the production for the next small observation 🙂
Thanks André Bachrodt, Germany
Thanks, André. Very true. I added the works council to the post (between “people observed” and “union representatives”). Thanks for commenting.
Good morning Mr. Roser,
i have to say that it is one of the easiest way to understand the basics of Spaghetti diagram. I have applied the same in my facility. I am working in an ETO environment and hence it was difficult for me to do a spaghetti for people since every machine has a fixed location to be worked on and the spaghetti diagram have helped me to understand the amount of walking a person has to do to search for material or information. I am also planning to do the same for parts but since there are thousands of parts running inside the factory and I am totally confused with that because I do not know which part should I consider and if i take all the parts then the spaghetti diagram would not be able to you know tell anything then. If you can please guide me Mr. Roser in this scenario.
Thank you so much in advance.
Hi!
Here a video l like on the spaghetti diagram.
Worth to see:
https://www.leanvlog.com/spaghetti-diagram-uttana/
Hi mr. Roser!
This site really helped me understand Spaghetti Diagrams as I needed it to complete my masters thesis. I was wondering if it is possible to use your example image of the spaghetti diagram in my thesis?
Thanks for a great article!
Best regards
Mathilda
Hi Mathilda, click on the images to see the copyright info. See also https://www.allaboutlean.com/permission-for-images/ for details.