A changeover is changing the set-up of a process from one product to the next. Reducing changeover times is a common and popular way to decrease inventory or to increase available work time (see SMED). Ideally, the changeover time should be zero, allowing true one-piece flow. In reality, however, it is often not zero. This post looks in more detail at the different phases of a changeover to help you understand the process better and to reduce your changeover times.
Introduction
 You may think that the duration of a changeover is simple. At one point you stop the process and the changeover starts. A bit later you start the process again, and your changeover ends. While there are processes that have such changeovers, there are also many more processes where the changeover is more complicated.
The changeover process is a disruption of your normal way of working. You could also call this unevenness (or Mura). This disruption can actually be seen from two angles: First, you lose parts that could have been produced otherwise. In other words, you produce less parts than if you would have had no changeover. Please resist the temptation to do less changeovers, as per my last post What to Do with SMED. Also, realize that you may lose parts not only during the full stop, but also before and afterward during the ramp up and ramp down. Generally speaking, the changeover duration is from the last part at full quality and production speed to the first new part at full quality and production speed.
Second, you spend additional work on the changeover that your people could have used otherwise. You have to prepare, do the actual changeover, wrap up afterward, and potentially do more work on quality checks after the changeover.
Loss of Production
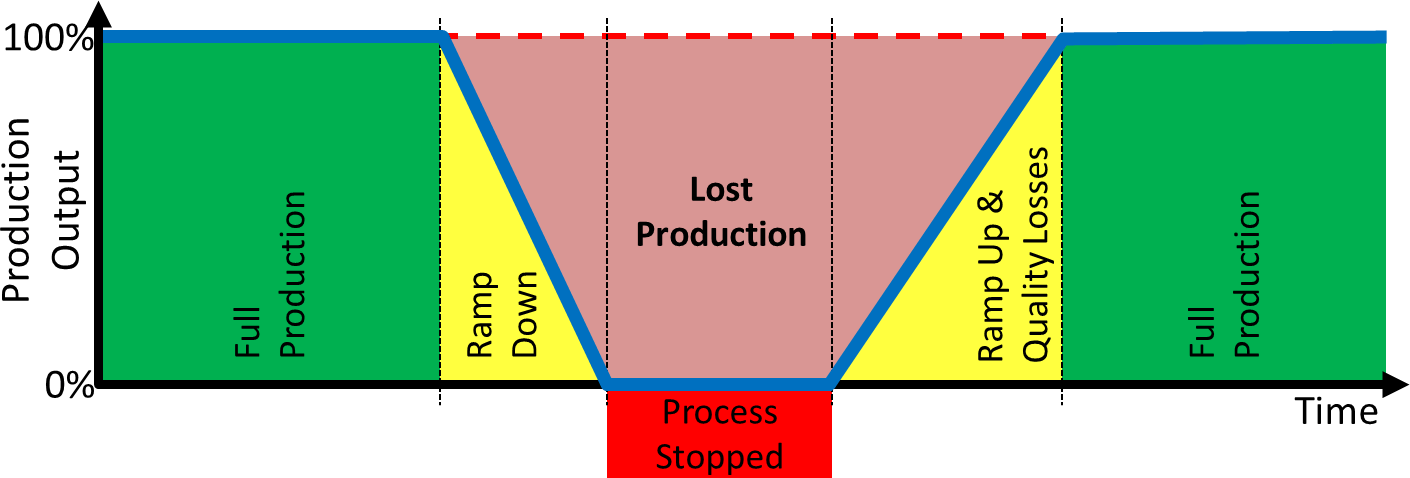
Let’s first look at the parts that could have been produced but were not due to the changeover. The image below shows the overview of these phases. Please note that not all processes and not all changeovers go through all of these phases. Please also note that I simplified the ramp down and ramp up as a linear change, whereas in reality the line may be more curved or even have erratic peaks and valleys.
Ramp Down
Initially, the process is running at full speed and quality. Depending on the details of the process, the changeover could start with a ramp down of the process. In most cases this will go rather quick. However, there are also situations where it could take more time. It is possible that the production rate decreases slowly. It is also possible that the quality problems may go up during the ramp down because the process is no longer operating at full capacity.
Examples are found in processing industries, where the process may run slower while emptying material. The produced goods may also be of inferior quality compared to normal production. It depends heavily on the process if there is actually a ramp down, how long it takes, and its impact on quality.
Stopped
The main part of the changeover is the time when the process is actually stopped. During this time, nothing is produced.
Ramp Up
The ramp up is more common than the ramp down. It often will take some time before the process produces good parts at full speed again. This may be for a number of different reasons.
It is common, for example, for production lines to need time to fill up again. Hence, when the line starts working again, it will take some time until the first part exits the line again. (Note: This can sometimes be avoided with a running changeover, more on this in a subsequent post.)
Another cause is that after a changeover, the settings of the process may have to be fine-tuned. During this time, there may be more frequent quality checks, adjustments to the process, and also a higher likelihood of inferior or defective parts.
Overall, you produce fewer good parts than during normal production, hence this is part of the production losses due to changeover.
Work Spent on Changeover
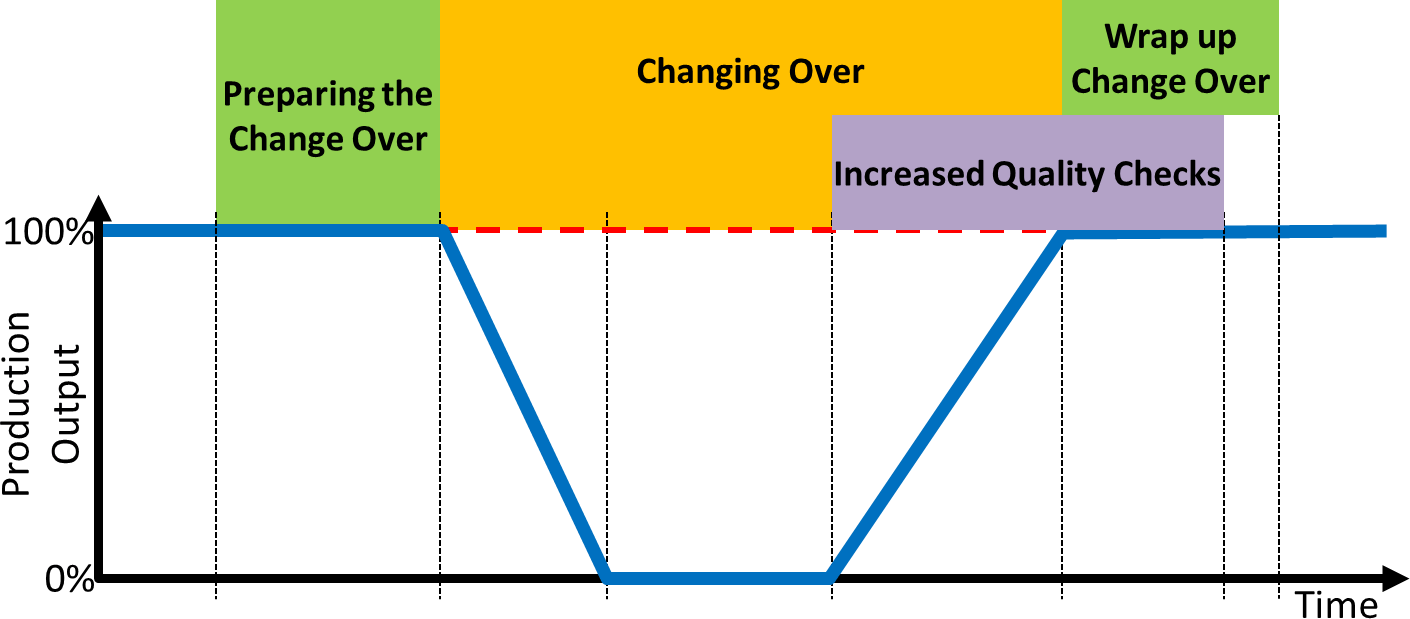
You can also see the changeover from the point of view of the work needed for the changeover. As per the SMED approach, you should do as much as you can before or afterward so that the actual changeover and the actual number of non-produced parts is minimal. An overview of the different tasks is shown in the image below.
Preparation
During the preparation phase, the changeover is prepared. You should have all the tools, the equipment, and the needed manpower ready before you start to ramp down.
Changeover
The actual changeover is commonly measured as the time from the last part at full quality and production speed to the first new part at full quality and production speed. This includes the ramp downs and ramp ups.
Wrap Up Changeover
After the process is running good parts at full speed again, the changeover is completed, and we can now wrap up the changeover. Return tools and equipment to their storage places, maybe do the maintenance on them or set them up already for the next changeover – these are all things you can do after the machine is running again.
Quality Checks

What many people often overlook, but what is also often necessary, is an increase in quality checks to make sure the process runs smoothly again and produces good parts. These quality efforts usually start when the machine is not yet at full speed, but when the machine just started to produce the first part. This actions often go hand in hand with the changeover to fine-tune the process settings. The increased quality checks may also extend beyond the duration of the changeover to catch quality problems caused by the changeover but happening infrequently. The details depend on your actual process, and again not all processes have this increased quality check phase.
Summary
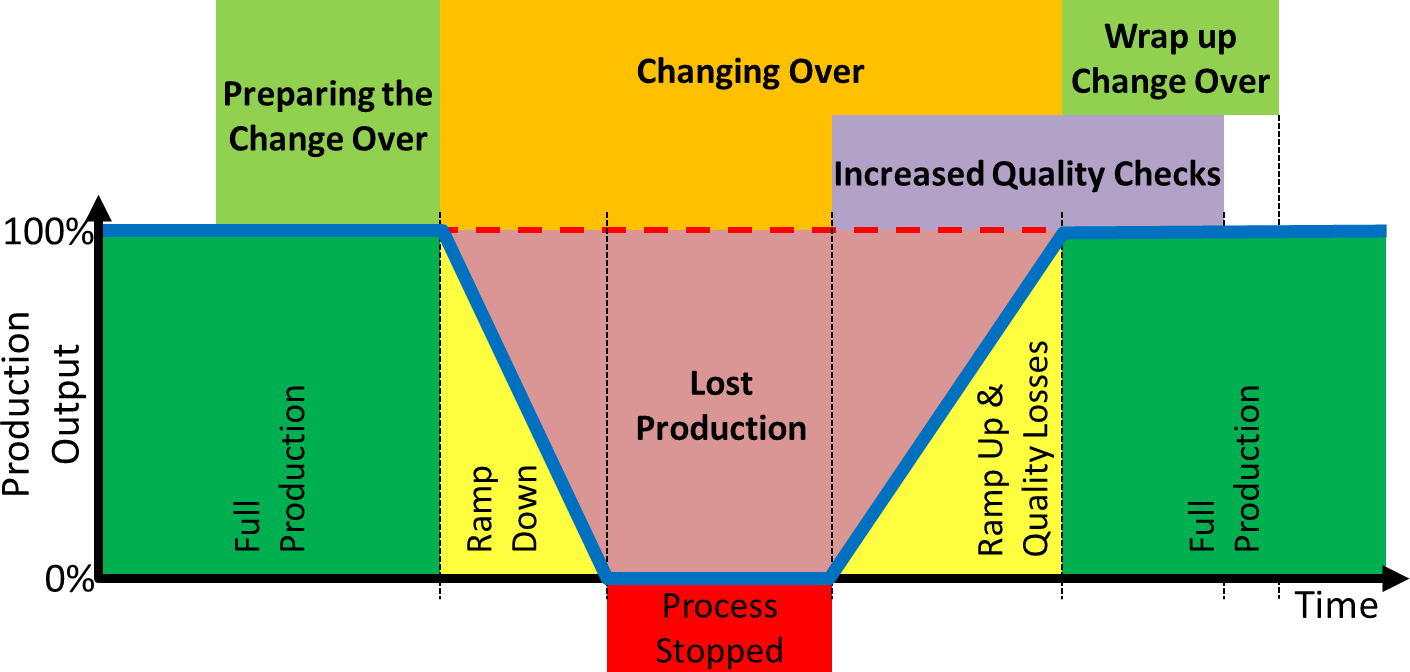
Overall, there are quite a few steps during the changeover. To reduce waste and unevenness, you can look at all of them for improvement. The image below is the combination of the two graphs above, showing both the phases causing loss of parts and the work steps for the changeover. And again, not all changeovers go through all phases.
In any case, I hope this article helped you to understand your changeover better. Now, go out, reduce changeover times, and organize your industry!
P.S.: This post is based on a question by Agus Santoso.


Nice diagram 🙂
This is still my favourite TPS technique. It was the one that opened my eyes to the power of TPS in the late 1980’s. I subsequently had the opportunity to study setup time reduction (SMED – single minute exchange of die – 9 minutes or less) under Shingo’s guidance. The genius of Sensei Shingo was the simplicity of his thinking. —
The SMED system starts on the basis that there are two categories of setup activities and time.. —
Internal activities. (Ti) These are the activities that are conducted inside the machine/process & require it to be stopped to conduct them safely. —
External activities. (Te) These are the activities that do not require the machine to be stopped to complete them & could be completed before or after the changeover. —
Preliminary stage. —
The first action is to study the changeover & record the steps taken, the total time (Ti1) & the time for each step. The timing must start as the last piece of the previous batch is completed & finishes when the first piece of the next batch is completed running at the required speed & quality. (When timing the work, record the steps with regard to being internal or external). —
We have found the ideal study team is; I setter. I observer, their job is to record and time the detailed steps of the setters activities. 3 fact collectors, these individuals record on post-it notes the detailed facts of the setter’s activities in each step.
Step 1. Separate internal & external.–
Using the study chart, Separate the step times into internal & external categories. Take the total of the external times (Te1) from the original total time (Ti1) & this is the new changeover time (Ti2). These external activities will now be conducted before or after the changeover. They will be individually improved in a later step. —
Step 2. Convert internal to external. —
Study each internal step & ask if it could be conducted as an external activity, done before or after the changeover while the machine is running. Taking the total time of these externalised steps from (Ti2) will give the new internal time (Ti3). Add this externalised time to the previous external time (Te1) and you have the new external time (Te2). —
Step 3. Streamline all activities. —
Study the details collected on the post-it notes about each of the internal (Ti) & external (Te) activity steps & improve them. Take the time saved from (Ti3) and (Te2) to arrive at your final internal & external times (Ti4) and (Te3). —
Write an action sheet to implement the changes required, & SOP’s for all the new internal & external procedures. Go back & repeat. —
Some key points. —
The core of a SMED team must be the setters & their support people i.e. tool room, maintenance, operators etc. They can do all the work required. We have conducted over 200 two day SMED events & this is the delegate mix we use. On day one we show the delegates the Shingo methodology and let them practice on a practical pantograph machine. On the second day they move to the shop floor to demonstrate what they have learnt. They will normally demonstrate a 50 to 80% reduction.–
When the setup starts no one should have to leave the machine. — Remember the basic rules of improvement is; Can we remove it before we improve it? Can we simplify it? Can we combine it? — Ask 5Y’s for each action in every step. — Eliminate all form of adjustment; everything should have a pre-set position & conditions. Standardise all shapes & sizes.–
Use parallel working where possible. (You must have safety interlocks for each setter). —
Define the work you are trying to perform, & eliminate all motion that does not contribute directly to its achievement. –(Work is defined as the motion required to produce what the customer requires). —
One of the best examples of Shingo’s system is a F1 car pit stop. Your machine/process is in a race with your competitors. When it roars into the pits is everything ready, is it back in the race as quickly possible & giving the performance required? —
Remember our goal is to achieve the 2 D’s; Delays – Minimum. Damage/Danger to our people – Zero. —
I have found that the combination of the work v motion equation & 5 Y’s thinking, along with the ‘remove it before we improve it rule’, can achieve amazing results in the hands of our front line people.
Very interessting analyzis , just I have remark how many days can taked the process stopped phases ? in case when WE have a shorty Time between thé Ramp down and Ramp UP which tooll you propose that can employed to reduce the Impact in quality and efficiency ?
Thanks
Hi Ali, this all depends on your system. Obviously the faster the better.
Useful post. Thank you.