
The cycle time of a process is a key to match the supply with the demand in lean manufacturing. Everybody working on a shop floor knows the term. Yet, I still find that people sometimes confuse what exactly it means. The cycle time is the fastest repeatable time in which you can produce one part. Hence, in this post as part of a series on manufacturing speed measurements I would like to dig deeper into what cycle times really are, and how to best measure them. As it turns out, there is actually quite some detail on how to measure cycle times, hence I split this post into two parts (second part How to Measure Cycle Times – Part 2), with an additional third post focusing on the details of manual cycle times.
Definition of Cycle Time

Most definitions for cycle time I have found online are rather basic, defining cycle time often as the time required to complete a cycle (Merriam Webster). However, for practical terms, this definition is way to broad. A much more useful definition for me is:
The cycle time is the fastest repeatable time in which you can produce one part.
Hence, it is measured as a time per part, and does not include losses like breakdowns, defects, and other delays (for more on losses see my articles on OEE). As with most other time measurements, you can also distinguish between the current cycle time you actually have (simply called cycle time), and the cycle time you want – the target cycle time.
Yet even this will leave some remaining ambiguity. For example, if you have batch processes, is the cycle time the time for one batch, or the time for one part? Depending on what you need the time for, both may make sense. Confusingly, I am not aware of an widely accepted name that distinguishes one from the other. Both are commonly called cycle time, regardless if for a batch or for a single part.
Please be aware that this definition above is far from universally accepted. Quite a few practitioners define cycle time to include losses. Others call the definition above an “effective cycle time”. This has significant potential for confusion! I strongly prefer to use cycle time only for times without unplanned losses or delays. In any case, if discussion takt times and cycle times with someone else, please verify what they are talking about! Based on a discussion on the LinkedIn Group TPS Principles and Practice, cycle time is more often defined excluding losses (Many thanks to all who contributed in this discussion).
How to Measure Cycle Times
The Easy but Terrible Wrong Way!
 Many people simply calculate the cycle time by dividing the working time by the number of parts produced during this working time.
This is terribly wrong! This is how you calculate the line or process takt time, which includes losses. If you calculate the cycle time using this approach, you include all the losses and breakdowns. Even if you pick a “good day”, you still have lots of minor delays, slow-downs, some defects, and so on that will creep into your measurement.
The More Convenient but Slightly Flawed Approach
 Another common approach to determine the cycle time is to simply look it up in one of the data sheets. When the machine was built, surely somebody must have set a time into the machine. Similarly, there is often data available on how fast a manual work should be. Often, this number is used without questioning.
While this number is probably closer to the truth, it still is far from good. The speed of machines change over time. The number you have received may no longer be correct. The number may also be only the primary process, but may not include the loading or unloading or other preparation. For example, in an injection molding machine I once had the situation that the “cycle time” included the injection and the cooling, but not the opening, ejection, and closing of the mold, hence the “official” cycle time was too short.
Similarly, for human operations there is often a time available based on MTM or REFA data. However, this usually includes 5% to 25% extra time for toilet or other breaks. While I totally agree to include the time when calculating the average target speed for the operator, it must not be included in the peak speed of the process. I will write more on that in the near future.
Hence, some practitioners say that you always must measure your data yourself. I am not that hardcore. Measuring it yourself will take quite a bit of time, especially if you have many processes (details see below). If you are short on time (and most people are), you can also use the data found in some documents. But please check if these numbers are approximately in the right ballpark. Also keep in mind that different part types may have different cycle times. I would not trust them without verification, but if the numbers are close enough I sometimes skip the detailed measurement.
The Most Precise but still Imperfect and Time-Consuming Way
The most precise way to determine the cycle time is to measure a number of individual parts. To determine the entire cycle time, you would need to measure the time between the completion of one part until the completion of the next part for multiple parts. This is the same as measure the time between the beginning of one part until the beginning of the next part. If it is more convenient, you could even measure the time between one action of the cycle and the same action of the cycle of the next part. I.e. if during the cycle there is a point where a light comes on, or an audio signal is given, or the computer automatically takes a time stamp, then you can also measure the time between successive lights/signals/time stamps for successive parts. In any case the result may look something like a chart below:
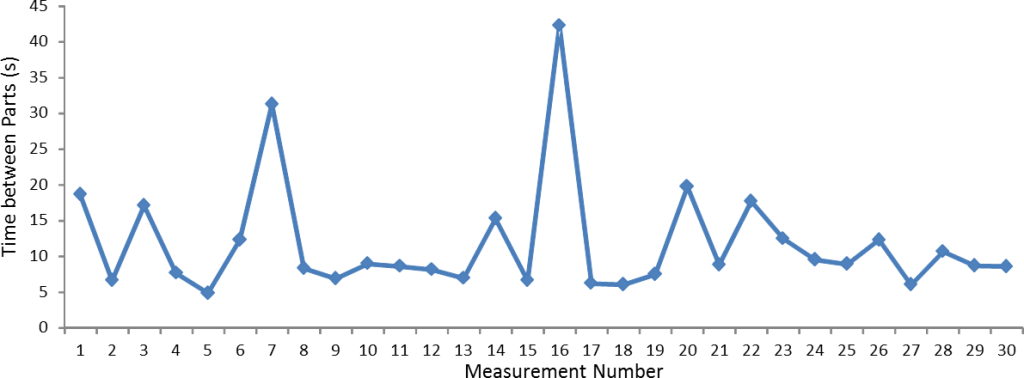
You will have variation. The question is: How to get the cycle time from this data set?
The smallest value in the data is 4.9 seconds. Yet, this is not our cycle time. Our cycle time should be repeatable, and the smallest value is not repeatable. In any case, I also often find that this is a measurement error. Hence, do not use the minimum as the cycle time.
What I also see way to often is people simply taking the arithmetic mean, i.e. the sum of all times divided by the number of measurements. Unfortunately, this is then skewed towards a larger value by the larger outliers.For example, if you measure the average wealth of 30 people, and one of them is Bill Gates (worth ca. $ 80 billion), then the average wealth of everybody is at least $2.6 billion, even if all the other 29 people are poor paupers.
Similar for the data above, measurement 7 and 16 seem to be very large. The arithmetic mean of the data set above is 11.8 seconds, and hence above most actual measurements. Do not simply use an arithmetic mean for cycle times. Sometimes I see the largest values discarded, and the arithmetic mean of the remainder used. It is possible to use the mean without these extreme values, although not my preferred way.
What I often do is to use the median or an percentile. The median is the measurement where half of the measurements are larger, and the other half are smaller. A 25th percentile (also known as the first quartile) is the measurement where 25% of the measurements are smaller and 75% of the measurements are larger. This would also work.
Yet even then the results differ. As shown in the graph below, the median is 8.8 seconds, and the first quartile is 7.1 seconds, a difference of 20%. Which one should we use? Or should we use the 10th percentile (6.2s), the 15th percentile (6.6s), or the 20th percentile (6.8s)? By the way, more measurements won’t bring the numbers closer together, since this is not a measurement error but caused by the underlying random distribution.

Here I don’t have a definite answer for you.As mentioned in the heading, this method is still imperfect. If i seem to have few outliers at the bottom (i.e. very small times) I often use the first quartile (i.e. the 25th percentile) or the 10th percentile. If i do have lots of outliers, I sometimes use the median. For example, I once had a system that generated automatic data, but due to a technical quirk often measured two parts with no delay in between. Hence, 1/3rd of my data had a time between parts of zero, and a quartile would then give me a cycle time of zero, which is not useful.
Hence, I cannot answer you definitely which percentile to use. Plot the data, look at the data and try to figure out what you think your system can repeat if there are no problems. If you graph the data as shown above, you can also simply put in a line where you think the cycle time fits best. As for the graph above, would you go with the Min, 1st quartile, median, or average value for a repeatable cycle time? For me, the 1st quartile would look best. I will talk a bit more about this problem in my next post.
Summary
Overall there are three ways to measure cycle times. A really bad one (divide work day by number of parts produced), a mediocre one (look up the [outdated? wrong?] data somewhere), and a time-consuming and still slightly flawed way (measure the individual cycles and take the best quartile or so). However, even with this data, there are still things that can go wrong. In my next post (How to Measure Cycle Times – Part 2) I will talk about the dangers of changing the sequence of the steps within a process, on different part types with different cycle times, and some general comments on the accuracy of cycle times in general. Stay tuned, and in the meantime Go Out and Organize your Industry!
Good post Chris.
Best approach I have seen is to take 20 cycles, exclude the data points with assignable causes and then calculate the arithmetic mean.
This approach is still a practical challenge though with slow movers and parts that have long cycles.
Furthermore, as takt and cycle times are compared it should always be at the part level.
Hi Rob, definitely a possible way to exclude outliers. I have done this, too, but have a slight preference for a median or percentile, simply because it removes the manual decision which points to include, and hence makes the times more comparable to others. This is a small effect, though.
Definitely agree on the part level!
Thanks, Chris, a nice story, but too long for quick readers and difficult to find the value added advice, which has appeared at the very end- to use median or quartile! at a part level.
Hi Elena, sorry that it was too long for you. I usually try to structure it with headlines to help people to skip to the parts they are interested in. Thanks for the feedback.
Hello,
therefore i use two Headlines for calcualting this times:
– Takt time … given by the customer
=> Cycle time … For our internal work balance sheet
( Takt time – 15% as the average summary of all loos times )
Best regards Christoph
How do you know your internal work balance sheet is correct? Also, if your real losses would be 10 percent, and you use 15%, then you just potentially added another 5% of losses by waiting. In my view a doable but somewhat risky shortcut.
For one process how many cycles should be taken
Hi Navaneeth, there is no fixed rule. The more you measure the more precise your result will be. Statisticians often recommend 30 measures, in practice due to time constraints it is often less in lean. Try to have at least 10 measurements.
Dear Christoph, amazing quality blog, thank you for taking the time to share your knowledge with us.
Your post helped me clarifying a great deal of the inconsistencies I find in litterature on cycle time. May I have your opinion on two points that are still obscure to me?
1) cycle time = (unit processing time * number of unit processed + set up time)/ number of unit processed. What to you think of this formula?
2) let an automated machine in which a part get in every 5 minute, and a part get out every 5 minutes. However, every part takes 2 hours to get through the process. What is the cycle time here?
thank you
Hi Carlo, thanks for the compliments.
As for 1) First I that the “unit processing time” does not include losses/waste, otherwise it would be a takt. For the cycle time I would exclude the set up time. In lean there is to my knowledge no need for a cycle time plus proportional set up time. If you want the overall speed, you use a takt. If you want to calculate a target speed of the workers similar to MTM, this would also include other parts like personal breaks.
As for 2), that is a good point, especially if it is NOT a batch process. I would consider the 5 minutes (without losses) a cycle time, and the 2 hours a process time. The question is what do you need the time for. If you want to determine the OEE based on line takt and cycle time, then you would use 5 minutes. Same if you want to determine the number of kanban.
Hope this helps,
Chris
hi chris
I have joined as a trainee in a garment industry.I am confused about the calculation of cycle time.some where i read that min cycle time is equal to max workstation time.
suppose there are 3 operations performed at 3 workstations on a single line taking 5,,3., and 8 minutes respectively.how to calculate cycle time for this?
Hi Sarim, not sure what you mean by workstation time. I don’t know that term.
Chris, I’m trying to calculate cycle time for a powder process where there are six distinct stations: dry-off, blast, powder, cure1, cure2, final at 15 minutes per station. Is total cycle time (15 x 6) 90 min, or is it 90 min to load the line then 15 min for every unit thereafter? Thank you.
OK, I see it. There is unfortunately some confusion in the wording. For me, cycle time is the time needed at one process to make one product. What you are asking for is either the total work time, or the line takt (in my wording). Please note that unfortunately there is no nomenclature, and everybody means something different when talking about cycle time. See my post On the Different Ways to Measure Production Speed. For you, both ways can be calculated, the important question is: What do you need the number for? If management just wants a number, just give them a number.
Thank you for the reply. The number will be used to calculate the labor standard for the powder process, so it becomes significant when developing the standard based on 90 min or 15 min (+ load time). I read your attached link and still think this is cycle time since we’re measuring the repeatable time to produce one powdered part. Regardless, knowing that our goal for the “cycle time” is to set labor standards, what do you think, cycle time = 90 min or 15 min (+ load time)? Thank you.
So you want to know how much parts a worker can produce in a certain time to determine targets? This is a bit tricky as there are many things that come into play (like rest times etc). In my experience it is often more political than factual. A system of predetermined motions could help (MTM, REFA, …)
Hi Chris,
I had a similar doubt when it comes to defining cycle times. Suppose for a case where machine can process 10 parts at the same time, can we use the complete time the machine takes to process 10 parts as a cycle time to figure out the quantity of products produced?
similar tricky case would be how to consider cycle time when we are splitting a single part into 4 pieces? Do you think the cycle time would be the complete time it takes to get those 4 pieces or time to get the single piece individually?
I’ve been doing time studies & performing statistical analysis for sample size of 30 for 95% confidence interval. I’m just trying to figure out how much time it would take to produce a certain amount of products so i can figure out the batch sizes?
Thanks
Regards
Very nice article. I dive into Six Sigma… what about using Shewhart control charts to separate special/common causes of variation and get to a repeatable value of CT?
Hi Luca, Shewhart control charts could also be used, but then you have the question again where you draw the border between “normal” and “special”.
Mr. Roser very interesting post.
I am currently developing a production monitoring system and your information will help us a lot.
In our case the information will be extracted directly from the machinery and processed in real time.
Thank you very much for sharing your knowledge!
Leandro
Hi Leandro, glad it was helpful for you!
Thanks for the detailed information shared. really a great post.
The best way is using a Gantt chart.
Hi Christoph,
You have been doing a fantastic work always by elaborating the terms in detail and touching the exact points required. You make the small topic interesting and important as well.
I have got a lot of valuable information and better understanding of a cycle time and data from this post.
Thanks again and best wishes…