
 In my last post I introduced the Toyota Practical Problem Solving approach (PPS) and gave an overview how it is rooted in PDCA and often used in the form of an A3. Now let’s dig deeper and go into the details of the individual steps. The first is to clarify the problem. The second is to break down and stratify the problem—to try to understand the problem better by looking at it from different angles, preferably using data. In my next post I will talk about target setting.
A Quick Recap
 As listed in my previous post, the Toyota Practical Problem Solving approach consists of the steps listed below.
- Clarify the Problem
- Break Down the Problem
- Set a Target
- Root-Cause Analysis
- Develop Countermeasures and Implement
- Monitor Process and Results
- Standardize and Share
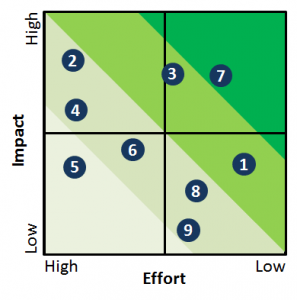 Before you start to clarify the problem, you may also need to consider which of your (presumably) many problems you want to address. You need to prioritize where you want to put your effort and resources. I usually like to do an impact-effort matrix, as shown here. Try to estimate the impact and the effort for all of your possible improvement projects, then select one that has a good trade-off between impact and effort compared to your other potential projects. See my post How to Manage Your Lean Projects – Prioritize.
Clarify the Problem
 The first step is to clarify the problem. Where exactly do you have a problem in your operations? This is not as easy as it sounds. Take great care not to indicate a solution while describing the problem. For example, if your problem is “not having kanban,” then you’ve already limited yourself to one solution. Besides, “not having kanban” is not a good way to describe a problem.
A problem is often a deviation from a target. You have a target (quality, productivity, cost, etc.), and your actual performance is not meeting these targets. If possible, try to express you target quantitatively (i.e., have a current performance measure that differs from the target for this performance measure). For example, if you have problems with frequent breakdowns of machines, measure the availability of the machine(s). If it is a quality problem, measure customer complaints, first pass yield, or similar quality measures. If you are not happy with your output, measure parts produced per hour or similar. If you can, make a graph, diagram, timeline, or similar visualization; it will be quite helpful.
Try not to narrow it down too much. This will be done in the next step. If you narrow it down too much, you may exclude a root cause that is a major influence on the performance. At the same time, try not to cast a too wide net either. Yes, I know, I am not very helpful here, as it should not be too big nor too small. Unfortunately, while in other cases most people tend to go in one direction (e.g., too much inventory), here I have seen both directions. Some people take a too high-level approach (e.g., analyze company-wide quality issues), while others take a too-narrow view (e.g., quality issue missing weld at process 30). If given a choice, I’d say rather go large then small. The nest step, “Break Down the Problem,” will narrow it down anyway, and it will probably be much more structured than a half-hazarded guess during the problem clarification.
Break Down the Problem
 Now that we have defined the problem, we need to break it down. Here we try to learn more details about the problem. Note that this is not yet developing a solution, but still only understanding more about the problem. Try to understand what is happening and what should be happening. If possible, also look at the problem on the shop floor and collect data.
This includes what Toyota calls “stratification.” Try grouping or displaying your data into smaller groups or aspects to analyze them. Try to look at the problem from different angles:
- When is it happening? Is it a certain time of the day? Is it something that did not happen before and now it is happening, and if so, when did it start?
- Where is it happening? Is it at a certain process in the value stream or work instructions? Is it with a specific supplier? Does it happen mostly in selected market regions or market segments?
- What is it happening to? Is it a certain product group or product? Is it a specific module or part? Is it a certain type of customer complaint? Is it a specific type of defect?
- How much is it happening (e.g., how much is produced)?
- Who is it happening to? Is it happening with a certain employee or shift? (Side note: If so, it is probably not a fault of the employee, but e.g. defective tools, lack of training, etc.)
Above are four bullet points (when, where, what, who) that you should consider. In reality, you may even have multiple aspects to stratify for the same bullet. For example, the question “what” for a quality issue could be looking at the type of complaint, the type of product, or the type of defect, etc.
For more complicated problems you can also try to split it into sub-problems. For example, if you find out during your stratification that there are multiple types of defects that ruin your quality, you may investigate these types of defect separately.
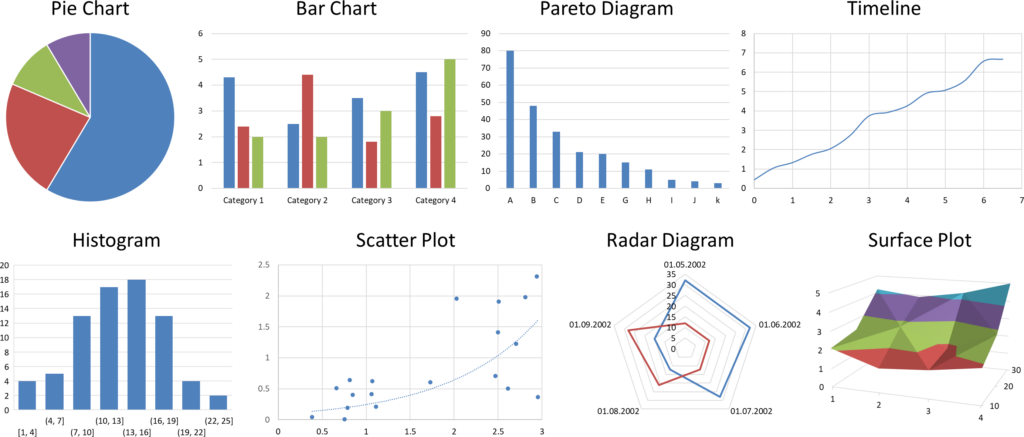
Whenever possible, use graphical charts and displays to visualize the data during stratification. There are many different ways to visualize data, like pie charts, bar charts, Pareto diagrams, timelines and trends, histograms, scatter diagrams, radar charts, surface plots, and many more. below are a few visualizations.
The goal of breaking down the problem is to better understand when, where, what, and who is happening. During the clarification of the problem I told you to look at the big picture. The breaking down of the problem narrows this down to the actual problem you are having. Toyota calls this the prioritized problem, and it is often confused with the root cause. This prioritized problem is an essential input for setting the targets… which I will discuss in the next post. Now, go out, define and understand your problem, and organize your industry!
PS: Many thanks to the team from the Toyota Lean Management Centre at the Toyota UK Deeside engine plant in Wales, where I participated in their 5-day course. This course gave us a lot of access to the Toyota shop floor, and we spent hours on the shop floor looking at processes. In my view, this the only generally accessible course by Toyota that gives such a level of shop floor involvement.