
In my previous posts I described the details of value stream mapping. However, value stream mapping works only for highly linear material and information flows. Unfortunately, many industry processes, especially in administrative or indirect areas, are all but highly linear. To visualize these processes, a new diagram was developed – the swim lane diagram. In this post I will show you how swim lane diagrams work.
A Quick Overview of Swim Lane Diagrams
At their core, swim lane diagrams are flow charts. The feature that distinguishes a swim lane diagram from a normal flow chart is the lanes in the diagram that represent different departments/functions/offices, etc. Since these lanes make the flow chart look like the lanes of a swimming pool, this type of diagram is often called a swim lane diagram.
Besides the most commonly used name, swim lane diagram, it is also called functional bands (in Microsoft Visio) or swimming lanes process mapping. The earliest reference I am aware of is a east German standard from 1968 (TGL 22452 Kybernetische Blockschaltbilder zur Modellierung von Organisationssystemen, Koordinatendarstellung, thanks to Ben Bolland for pointing that out). [Actually, Braz commented below and found an even earlier example from the US Bureau of the Budget bulletin on Process Charting from November 1945.] They are also sometimes known as Rummler-Brache Diagrams based on the 1990 book Improving Performance: How to Manage the White Space on the Organization Chart by Geary A. Rummler and Alan P. Brache. Yet, in lean there are few things that cannot also be said much more fancily in Japanese, hence they are also known as makigami (巻紙). However, translated this means nothing more than a roll of paper, since makigamis … sorry … swim lane diagrams are often created on a big roll of brown paper.
Where Are Swim Lane Diagrams Useful?
Swim lane process maps are used for information flows (and to a lesser degree also material flows) that involve different separate entities that are not necessarily working in a linear sequence. It is often used for administrative processes as, for example, order processing, part development, marketing, etc.
What Kind of Entities Could There Be?
The defining feature of swim lane diagrams is … well … their swim lanes. Each lane represents a different entity. An entity is usually associated with a certain function. Hence, it could be a department, a subgroup of a department, an office, individual people, or it could even be larger than a department as, for example, a plant, a site, the customer, or the suppliers.
What entities you will need depend on the problem you are trying to address. The diagram should include all entities that are involved in the process you are trying to visualize. In my experience, I usually end up between 4 and 12 groups. If there are less, then the diagram may not be detailed enough. If there are more, you may get lost in the details.
What Flow Is Shown?
In swim lane diagrams, you follow the processes of a certain job or document. For example, if the customer calls and places an order, how does this order flow through the different entities until the customer eventually gets its part?
This primarily includes information flows. Which group gives which information to what other group? If the customer representative forwards a request to Development, this would be an information flow. Swim lane diagrams can also include a material flow. While this is common, in my experience the material flow is usually only a minor part of the flows.
What about the Nonlinear Sequence?
In value stream mapping, the material flow is usually highly linear. Administrative areas on the other hand are much less linear. This is where the swim lane diagram comes in handy. In this diagram, it is no problem for flows to split and merge again later. For example, the billing office may work on the same project at the same time as Development.
Similarly, information can also go in circles (which is unusual for value stream maps). For example, Purchasing could find out that they did not get enough information from Development, and hence calls Development for more information or sends the document back to development altogether. Potentially a document or a job could go around in circles for multiple times.
How to Do a Swim Lane Diagram
Who Should Do It?
You can do a swim lane diagram on your own or as a team. If you work in a team, you may get more information out of it. Try to include people from the areas that you are looking at. A good team size would be 3 to 4 people.
Do it on Paper?
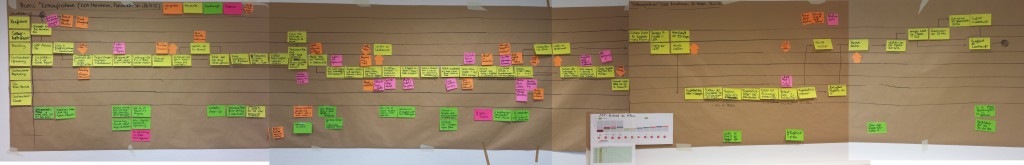
For almost any kind of diagram, I prefer working on paper. It is easier, faster, and can be an interactive experience if you work in a team. Ideally, you have a large pin board on wheels and brown packing paper. If the pin board has wheels, then you can actually move it around while you observe the system. I use brown packing paper since it is cheaper, but if you prefer/have good white paper, that works too. The color doesn’t really make much difference.
To make such swimlanes diagram, I recommend not using a pen or marker. This will be confusing later if you add all the information flows. Rather, I recommend folding the brown paper every 10 or 15 cm (4 to 6 inches). These folds show up well enough to indicate lanes, but cannot be confused with flow arrows later on.
For the different steps in the lanes, you can use simple pin board cards. The connection flow arrows are drawn directly on the brown paper using any kind of flip-chart marker. Another possibility is to do it on a whiteboard using post-it notes an marker, which also makes it easier to rearrange.
Do It Digital?
Swim lane process diagrams can also easily be produced digitally, and are included in many flow chart products. For example, in Microsoft Visio, look for the term “functional bands.” However, I prefer paper over computer. For one thing, it costs time. All the effort needed to handle the software takes brain power away from actually understanding the problem. Your brain will look for good ways to draw it, rather than looking for problems and ways to improve it. Do not underestimate this type of brain drain!
Additionally, if you work in a group, it is much more difficult to interact while creating a computer document.
The advantage of digital is, of course, that it looks nicer and is easier to print, e-mail, or otherwise share. Hence, you can impress a lot more people that neither need nor understand these diagrams.
Horizontal or Vertical?
You can do these diagrams either with horizontal lanes or vertical lanes. When I am working with paper, I usually go for horizontal lanes, as it is easier to make a larger diagram by putting multiple pin boards next to each other. If I have to use a computer, I go for vertical lanes, as it is easier to scroll up and down. Both work; use whatever fits your problem best.
Do It Where It Happens!
Probably most important is to generate the diagram in close interaction with the people doing the tasks on the diagram. Ideally, you can walk through the different offices and interview people or observe them doing their work.
When interviewing, keep in mind that people usually tell you the way it should be (because that’s all they usually are ever asked). However, we want to know how it really is! Hence, with every person you talk to, do some digging for things that do not go as planned, where the information was incomplete, or where the information is simply wrong. Try to incorporate this in your value stream map as much as possible! That’s where the value of a swim lane chart is!
Where Should I Start?
In value stream mapping, the mantra goes to start at the customer side (see my full post on Value Stream Mapping – Why to Start at the Customer Side). However, for swim lane flowcharts, in my view either direction is fine. Actually, since the information often goes in loops, you would need both directions, or at least ask at every stop to understand both directions.
What Goes on the Diagram?
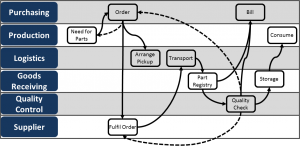
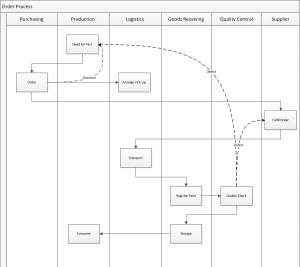
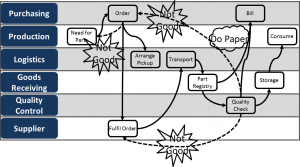
First, I would label the lanes with the offices that I know will be part of the diagram. Keep some lanes free for additional functions you come across later. Then I would add the starting process by drawing a box and writing the action inside of the box. This could be, for example, the customer calling and placing an order. From there on, I just follow the flow of information and material and add more boxes. These boxes are connected with simple arrows.
Please keep in mind that flows may split, merge, and loop. For normal information flows as they should be, I simply use a normal straight line arrow. For recursions and non-standard information flows, I use dashed lines or a red pen to indicate that this flow is not how it should be. This will help you to understand where waste occurs.

 I also use star shapes to note problems that I observe and cloud bubbles for improvement ideas. If your diagram has only a few of those, then you are doing something wrong. Mine are usually quite full with these items. In fact, these problem and improvement ideas will be the biggest benefit you get from a makigami! For added effect, you can also use colored Post-its for problems (red) or ideas (green).
Feel free to adapt and adjust the style to fit your needs. For example, if you want to use a diamond shape for decisions, by all means go for it. The symbols for swim lane diagrams are even less standardized than those for value streams.
Gizmos and Gadgets to Avoid!

There are more things you can do with a swim lane diagram. However, just because you can does not mean you should! For example, in value stream mapping, some people draw an up-and-down line underneath the entire map to show the value-added time and the non-value-added time. I don’t even like this for value stream maps (see my post), and it is even less useful for swim lane diagrams. Due to the loops and very different work content between different jobs, you probably will be hard pressed to get meaningful data. For example, if you handle incoming orders, you will have some customers that are a breeze and others that you wish never ordered.
Similarly, some people will tell you to add all the data and cycle times to the diagram. Don’t do it unless you really need it! Especially with usually little-standardized processes often found in swim lane diagrams, these times have a high variation and are probably next to useless.
Current and Future State
As with value stream maps, you should start with a current state. This alone may give you enough improvement potentials to keep you busy for weeks.
You can also do a future state for a swim lane diagram, but again: Do it only if it helps you. If you do not plan to revamp the flow but only improve on the current problems, you probably don’t need a future state.
Summary
A swim lane diagram hence is useful for nonlinear information flows across multiple departments or groups. It can help you to see problems, but it is only a tool to see them, not to fix them. The real work comes afterward in improving all the little details and problems you found. Yet, applied in the right situation and to the right problem, it will help you organize your processes. Hence, go out and organize your industry!
thanks alot…it’s well written
We are mapping a shipping process (papers). We did not know this diagram. We will use for sure.
I used to work in a services company.
We did these diagrams to develop the new processes and to improve the actual ones.
Its a very good tool for it, and easy to use.
Hi Christopher, Thanks for sharing this knowledge!
FYI: the swimlane has a much longer history than the 1990-s.
Already in 1968 our DDR friends created a national standard, the TGL 2245: http://swimlane.info/tgl.htm
And I remember I ‘ve been educated in it during my Chemical engineering study in the 70-s.
Working on process improvement projects in the last 8 years my experience is, simples swimlane schems are the easiest way to communicate processes with both managment and operations level.
And isn’t that where pictures all are meant for? Communicating, discussing issues and improve outcome?
Hello Ben, thanks for pointing the DDR Standard out, I did not know that. I have updated the article above to reflect your input. It is indeed a good tool to communicate.
Best wishes, Chris.
Hi, mr. Rose: there maybe is an even earlier reference to what today is the Swim Lane diagram:
http://www.worksimp.com/articles/pdfs/processcharting.pdf?pdf=Process-Charting-1945
Process Charting – Its use in procedural analysis, November 1945, Executive Office of the President Bureau of the Budget – U. S. Government.
Thank you for sharing your knowledge with the world, best regards
Hi Braz, very cool! I did not know about that. I updated my blog post with your new information. Thanks so much for sharing!
Hi Chris, found some more info on Geary A. Rummler and the influence of Rummler-Brache diagrams on IBM’s process methodology called LOVEM and UML diagrams: http://www.bptrends.com/publicationfiles/advisor20081209.pdf
Best wishes
I came across swimlanes in most production process diagrams.Some good examples I found are from the diagram community of Creately Flowchart Software . This will help you to learn different uses of swimlanes.
Short, clear and rich, great article. Thanks
Questions of this part analyze the students’ understanding in analyzing the given scenario and practical skills to build Swimlane diagrams studied in Chapter 9 of IT242.
The following paragraph depicts the activity of handling the delivery of books initiated by the delivery employee and mentioned in the “MyBook” scenario. Draw a Swimlane Diagram for the given activity. (8 Marks)
The process starts when the delivery employee logins to the system. The system verifies his/her credentials. If correct, he/she can proceed otherwise he/she gets two other chances and after that the process ends. The delivery employee views all the books that he/she is supposed to deliver then enters what time he/she will come to pick them up. The delivery employee can also reject the delivery job. If he/she accepts the job, the system sends a message to the “MyBook” delivery handling employee about the time in which the delivery employee will come to pick up the books, then the process ends. If the delivery employee rejects the job, the system sends an alert to the “MyBook” Manger. The Manager assigns the job to another delivery employee and the process ends.