
 In my last post I started to look at when to produce make-to-stock and when to produce make-to-order. There are quite a few factors that influence this decision (more on this in my next post), but the most important ones are the total sales or production volume as well as the fluctuations thereof. To understand these, you could use a Pareto analysis, an ABC analysis, or an ABC-XYZ analysis. I do like to include not only quantity but also fluctuations, but usually I need to divide this into only two groups, and the three groups of ABC or nine groups of ABC-XYZ is, in my view, a bit of an overkill. Anyway, let’s have a look:
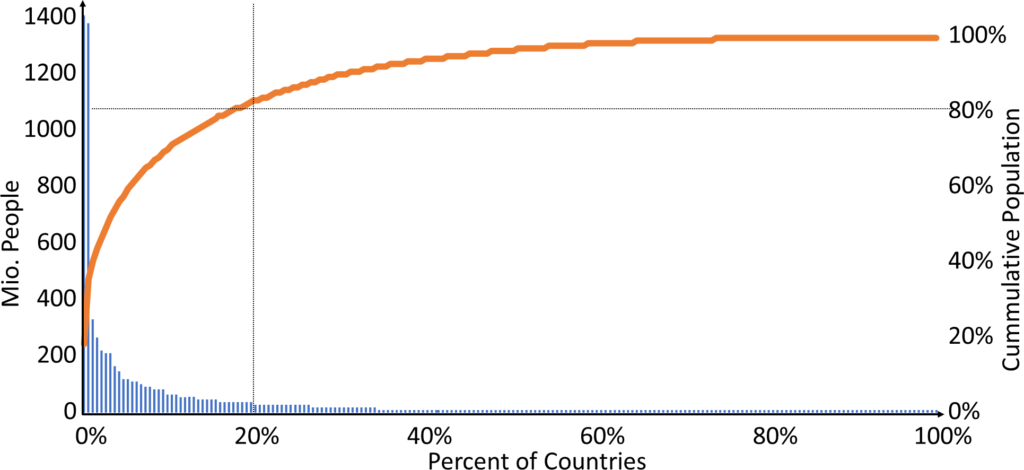
Pareto Diagram
As discussed in my last post, the quantity as well as the fluctuations of the demand are relevant to decide if you produce make-to-order or make-to-stock. Sorting your products by quantity is easy; this is the Pareto diagram. For many data sets, you will also find that 80% of the volume is 20% of the products. Below is a similar example, where I plotted the world’s population by country, both in million people and as a cumulative percentage. Roughly 20% of the countries make up 80% of the world population, starting with China, India, and the USA. Correspondingly, 80% of the countries make up 20% of the population, ending with Nauru, Tuvalu, and the Vatican City.
ABC Analysis
 The ABC analysis is nothing more than a Pareto analysis grouped into three levels. A’s are the most common items, B’s the middle group, and C’s the least common ones. However, there is no consensus as to what percentage is A, B, and C. Often a ratio of 20% A, 30% B, and 50% C is used, but there are also others that use 10% A, 20% B, and 70% C. There are probably many more, but the point I want to make is that this grouping is somewhat arbitrary and depends on your needs. Besides, you may not need three groups anyway; often two groups are just what you need.
| ABC | A | B | C |
|---|---|---|---|
| Variant 1 | 5% | 15% | 80% |
| Variant 2 | 10% | 20% | 70% |
| Variant 3 | 20% | 20% | 60% |
| Variant 4 | 20% | 30% | 50% |
| Variant 5 | 75% | 15% | 10% |
| Variant 6 | 80% | 15% | 5% |
Even if the quantity alone would decide between make-to-order (Probably C’s?) and make-to-stock (maybe A’s), you cannot just use a fixed percentage value to decide. Instead you would have to look along the axis and decide at what point it is no longer worth having the items in inventory. Depending on your business, you could end up with 100% make-to-stock items. A completely different business may end up with 100% make-to-order items. But don’t just use a percentage. In any case, the fluctuations also matter, which brings us to the ABC-XYZ analysis.
ABC-XYZ Analysis
 The ABC-XYZ analysis now includes the fluctuations. The ABC parts is still a simple Pareto of the quantity, grouped into three groups. Sometimes it is alternatively the product value if you want to give more expensive products a higher priority than cheap products, but this would be not so good for the decision between make-to-order or make-to-stock.
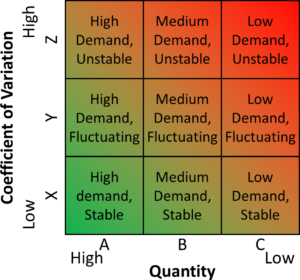 The XYZ part now captures the fluctuations, also grouped into three groups. You can also think of it as capturing the uncertainty or the stability. X-items fluctuate very little, Y-items somewhat more, and Z-items quite a bit. Technically, the fluctuations would be the standard deviations of the demand (i.e., the standard deviation of how much products you sell per day or per week). However, since you are comparing products of different absolute quantities, the coefficient of variation (the standard deviation divided by the mean) is better. This is a good measure, and it is sometimes used.
 Another possible measure is the number of orders (e.g., orders per year). A high number of orders is seen as a stable demand, whereas a low number of orders is seen as an unstable demand. This is easier to measure, but is not as accurate as the coefficient of variation. For example, the Christmas cup from my last blog post may have a lot of individual orders where a customer orders one cup. However, these orders are all clustered around the Christmas season, and you still have a lot of fluctuations. The coefficient of variation may here be a better option. But for seasonal fluctuations you may have to switch between make-to-stock (in season) and make-to-order (out of season) anyway. Overall, what you are trying to measure is how stable the demand is.
 Do not confuse the ABC-XYZ analysis with a plot, where the axes are simply the values (although you can do that too). For ABC-XYZ, the axes are merely the products in sequence as sorted by its KPI value, not the absolute value. In other words, both axes markers would have merely 1, 2, 3… n for your n products.
Overall, the AX parts are your high volume and stable products (often the easy money-makers), and your CZ parts is the small fry that is ordered very irregularly (often the troublemakers with little money).
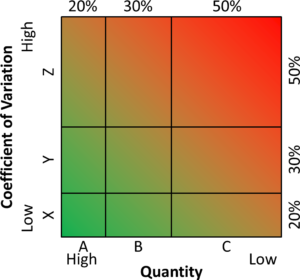
Most examples online simply show nine equal-sized boxes as the image farther above. You can also split the areas using a different percentage, the image here has a 20%-30%-50% split. But in my view, it is not necessary to use 9 boxes, or even more for the ABCD-WXYZ analysis with 16 boxes (same thing but more divisions), or even more with the (luckily uncommon) Kubus-analysis with 27 boxes (they add a third axis to make it a cube, all axes sliced into 3 parts).
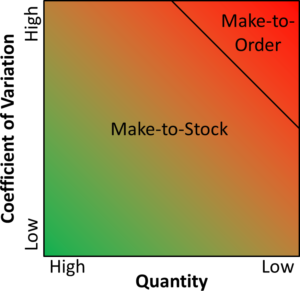 But for me, all of this is overkill. You basically want to split your products into 2 groups, those that are make-to-stock, and those that are make-to-order. Hence, usually you need only 2 groups, not 9, 16, or 27, unless you want to impress someone else with fancy graphs and diagrams. Keep in mind that an AB-YZ analysis would not sound as nice and also would not sell as well for consultants. For 2 groups, however, some sort of diagonal line is all you need, as shown here.
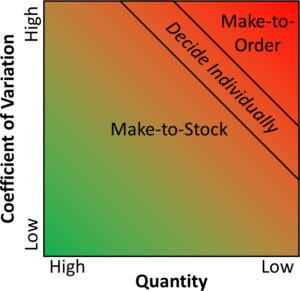 You may also look a bit closer at products that are close to the line, and may decide individually which group you want them to be. The question is where to put this line, and what to consider if you want to change a product from make-to-order to make-to-stock or the other way round (more on this in the next post).
By the way, the products are usually not spread evenly across the chart. You probably have a few products with high quantity and low variability (AX), a lot of products with a low quantity and a high variability (CZ), and some in-between (BY). High quantity AND high variability (AZ) as well as low quantity AND low variability (CX) are less common.
In my next post I will look at where to split, and what else can influence this decision. Until then, stay tuned, and go out and organize your industry!
Dear Roser,
1st comment is related to recognize your contribution to adopt a Lean Mindset.
About the different factors, more frequently many, affecting Work Orders, I suggest to start with only 3 variants and 3 different criteria to quantify (High, Med and Low). And split within small areas to be able to Manage Inventory. Knowing that High Volume, i.e. Automotive, manages about 5,000 components to assemble One Unit (automovile), have a Large Complexity to manage Inventory.
One we are optimized one small area, move to a next…and so on.
Thanks in advance for commenting.
Hi Alejandro, good point. I usually start by analyzing all products on a line or process, before analyzing the next product.
I think cost of good sold could be an element to make this decision. we don’t want to take risk of holding highly costed products, thus cheaper to make items should be make-to-stock
Hello Hieu, definitely! In my next post I have a list of decision factors, which includes the price and also the size, plus some more.
Hi Christoph !
Interesting read, do you know about any papers that refer to the Kubus-analysis; I tried looking up for it and couldn’t find any. I know you think it’s overkill but I would like to know some more about the technique.
Hi Jane, I don’t know any academic paper. It seems to be merely an idea somewhere else. Sorry.
Hi Christoph,
Is it recommended to perform ABC-XYZ analysis for designing material replenishment system based on ABC dollar usage value ($ consumption value) instead of pure quantity value?
Will there be any issues that may cause lapses or weaknesses in the system?
Thanks,
Wayne
Hi Wayne, this is a detail that depends on what you need the ABC for. I usually take data that is readily available. Often I also use simply the count of parts.
With reference to the same question above, the intent is to use this demand segmentation strategy based on ABC ($ consumption) with XYZ (CoV) analysis to design a system (MRP, Min-Max and manual Kanban) to optimize inventory cashflow, prevent stock-out and improve buyer’s productivity to focus their efforts more on the 10-20% parts that matter.
Hi Christoph,
I read some articles translated to Chinese. The translation quality can be improved. I feel the translation is look like done by google translation tool.
Is it too simplistic to say that the main determinant of MTO v MTS is the manufacture lead-time versus the customer’s expectations of order to delivery lead-time? If the manufacture lead-time is uncompetitive then something has to be done to shorten it (eg. ATO / MTS and other approaches to lead-time reduction) and these options might be worth evaluating in an MTO environment to get a competitive advantage.
Hi Simon, I think that is too simple. See my post When to Produce Make-to-Order, When Make-to-Stock? for more details.