
 SMED (Single Minute Exchange of Die) is a very useful tool to reduce changeover time. Reducing changeover time will free up time for other uses. Western management often wants to use this time to produce more goods. However, the rule of thumb at Toyota is to use this newly available time to do more changeovers rather than more products. This increase in changeover has the potential to significantly reduce the lot size, which often has much larger benefits than the additional work time. In this blog post I want to look in more detail at this relation between changeover duration, productivity, and lot size.
Quick Recap: SMED
SMED (Single Minute Exchange of Die) is a structured approach to reduce changeover time. The seven steps are:
- Measure changeover times
- Identify internal and external elements
- Try to move as many elements as possible to external
- Shorten internal elements
- Shorten external elements
- Standardize and maintain new procedure
I have written a series of posts on how to do SMED, its history, and some SMED exercises, hence I won’t go into more detail here.
A Simple Model
SMED can reduce your changeover time. You can use this time either to free up time or to do more changeovers (or anything in between). To illustrate the effects, I use a simple system with few parts. For simplicity, all parts have an equal share of the production time, and all changeovers take the same time. Production and consumption are also constant. I also assumed we need no safety stock. This is, of course, not quite realistic, but it makes the picture easier to understand, while still allowing valid conclusions for real-world situations.
Initial Situation, Two Parts
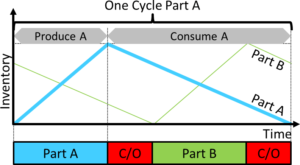 In the first example I have two parts, part A and part B. As shown in the graph, we start to produce A, do a changeover, then produce B and do another changeover. After the second changeover, we again produce part A and repeat the cycle.
The inventory of parts A increases during production of A, and decreases during all other times. This is similar for part B. Hence, we need enough inventory to cover all other times. When the production run of part A has finished, we need to have enough parts to last us for two changeovers and the production run of part B before we get any more parts A.
Initial Situation, Three Parts
 A similar picture can be drawn for three parts. The production run of part A has to last until we produce more of part A again. This will be after three changeovers and the production runs of part B and part C. The behavior is again similar if you have four or more parts; you always have to cover the time until you produce part A again.
Half Changeover Time after SMED
Now assume we did a SMED workshop, and would have been able to reduce the changeover time by half. Now the changeover takes only half the time as it did before. This gives us two options.
Free Up Time
 The first option is to free up time. The picture shows the initial sequence of production and changeovers on the top, and the new sequence with the changeover time reduced by half at the bottom. This would free up time equal to one initial or two current changeover times.
We could now use the time to produce more parts, or to send workers home, or to do maintenance, and so on. However, let’s also look at the option recommended by Toyota, to do more changeovers.
Do More Changeovers
 If we use more changeovers, we can do exactly twice as many changeovers as before since we reduced the changeover time by half. The picture again shows the initial situation on top, and the current situation with two production runs at the bottom. Each part is now produced twice during this period. For clarity I only show the inventory of product A over time.
The amazing thing here is the inventory! With the more frequent changeovers, you now need only half the inventory. The image shows the initial inventory with the dashed line, and the current inventory with the solid blue line. Both the peak inventory and the average inventory have been halved. As lean experts you surely know the value of reducing inventory, which quite often exceeds the value of the freed-up time.
A More Detailed Look
The above examples looked at specific examples. Putting this on a more general basis, there are two main variables that can be varied:
- What percentage of the total time is used for changeovers (i.e., the ratio of the sum of all changeovers divided by the total time). For example, if you have a 7-hour shift, and during that shift you had a total of 1 hour of changeovers, then you would have 1/7th or roughly 14% changeovers.
- How many different part types do you produce? This could vary from 2 to infinity (with 1 being a special case: if you have only one part, you will never have a changeover).
 For simplicity I assumed that all changeovers and also all production runs for parts are of identical length. Looking again at the example from above, there are two parts A and B, with an equal production duration and two equal changeovers. The changeover time was 32% of the total time. Each change over took 16% of the total time, and each production run took 34% of the time. For the example with three parts, it was three times 22.6% production time and three times 10.6% changeover time.
Total of 10% Changeover Time
Let’s start with the graph that shows the relation for an initial total of 10% changeover time (i.e., the sum of all changeovers is 10% of the time). Why 10%? Because Toyota believes their production lines should have changeovers for 10% of the time. However, while this works for Toyota, it does not mean that this works for everybody, so don’t go rushing out telling your guys to do 10% changeovers.
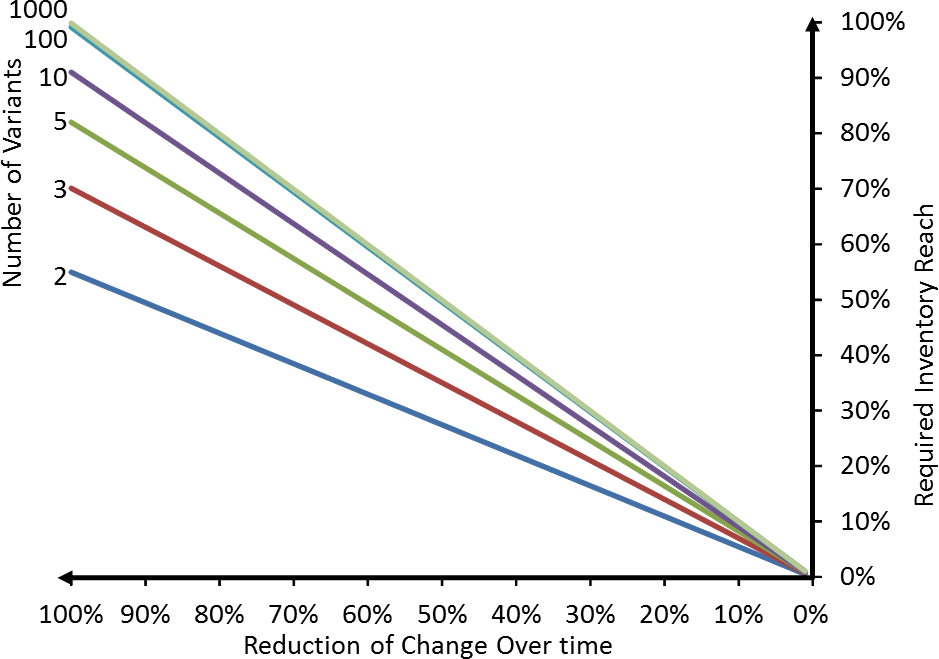
The graph is a bit more complex, so let me go through it in steps. Let’s start with the blue line for 2 parts. If you have not done anything to your changeover, then you would need an maximum inventory reach of 55% of the time.
 In other words, after producing part A for 45% of your cycle, you would need two changeovers with 5% of the time each plus the 45% time to produce part B. Hence, you would need to cover 55% of the time between the beginning of a production run for part A and the next beginning of a production run for part A. This increases if you have more part types, approaching a inventory reach of 100% of the time between the beginning of a production run for part A and the next beginning of a production run for part A.
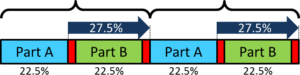 If you now start to improve your changeover time, this inventory reach goes down. If for example you could reduce your changeover time by 50%, you would be able to have twice the number of changeovers, and hence every production run would need to be only half as long. The time you would need to cover would also be reduced by half. Instead of an inventory reach of 55%, you would need only an inventory reach of 27.5% of the time between the beginning of a production run for part A and the next beginning of a production run for part A.
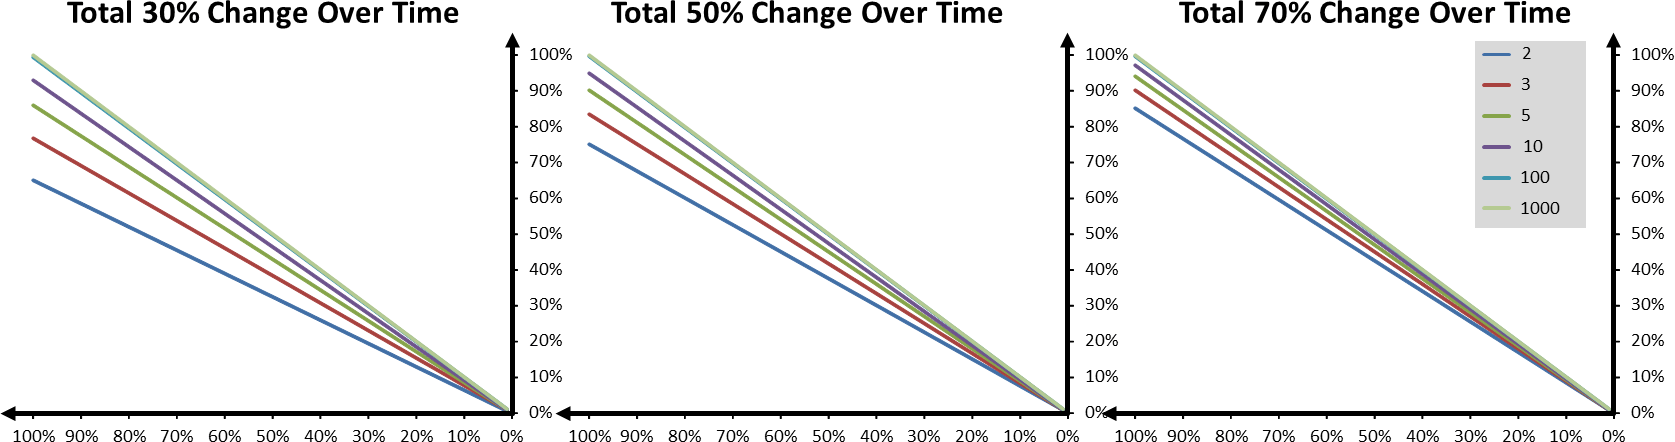
30%, 50%, and 70% Total Changeover Time
I did this also with other percentages of total cycle time. The graphs below show the same data for 30%, 50%, and 70% changeover time, although these are unlikely to happen in industry (if you do 70% of the time changeovers, you have only 30% of the time left for production). These graphs also show a similar relation to the graph above.
Summary
Overall, the picture is very clear. If you reduce your changeover duration and put the gained benefits in more changeovers, then your inventory needed to cover the changeovers can be reduced by the same percentage that you reduced your changeover time.
For example, if you reduce the change over duration by 50%, then you can reduce your inventory needed to cover these periods also by 50%. If you reduce changeover duration by 75%, then you need 75% less inventory. If you manage to reduce the changeover duration to zero, then you need no inventory at all to cover for changeovers.
Please note that you still need inventory for other purposes (e.g., to buffer other fluctuations, or as safety buffer). Yet a SMED workshop and the resulting reduction in changeover time can drastically reduce your inventory.
Of course, while it is generally recommended to put this gained time into more frequent changeovers, there are also cases where you may want to put it into more parts rather than more changeovers. For example, if your customer is screaming bloody murder because you lack the capacity to produce what he wants, then you better use the time to produce more rather than smaller lot sizes. You can also use a mixed approach and put part of the time toward producing more, and another part toward smaller lot sizes.
As always, there is no fixed rule, but it all depends on the situation you have on the shop floor. I hope this post was insightful to you. Now, go out, reduce your change over time, and organize your industry!
A good Insight on SMED & its Proper Application.
Hi Prof Christoph,
Nice article
I want to ask :
1. Do SMED can be implemented in job shop with ± 1000 different items ( ignore qty ) each months ?
2. Do SMED is the same or something similar with ” heijunka ” ?
Thx,
Agus
Hi Agus, 1) yes, it can. Start with a change over on a machine that has long change overs or may give you the biggest benefit from a change over reduction. 2) they go in the same direction, but are different. SMED reduces change over time. Heijunka aims to smoothen production. hence, SMED can help with Heijunka.
Thank you for the explanation ^_^
Best Regards,
Agus