
 Yet another hot topic in lean manufacturing is visual management. This can be very helpful in running a shop floor, but when done wrong it can also be quite wasteful and embarrassing. In this post I would like to show you the basic principles of visual management with a few examples. There is more to visual management than merely putting lines on the shop floor.
The Basic Idea
 Visual management aims to make the situation easily understood merely by looking at it. The goal is to get as much information as possible with as little observation or time as possible. Visual management complements well with the idea of going to the real place (Genchi Genbutsu). It also intertwines closely with 5S.
Like most topics in lean, you can use the English phrase Visual Management, or you can use the Japanese term. While I prefer English when speaking to an English-speaking audience, the Japanese term is Mieruka (見える化 with 見える or mieru for being able to see and 化 or ka for the action of making something).
Four Approaches to Visual Management
In my view there are different directions you can go with visual management. I will discuss them here in order of preference, with the best one at the end.
Visual Management with Data Displays
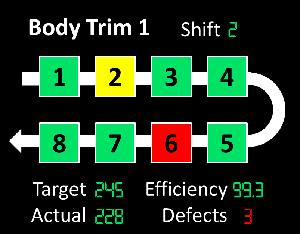 Visual management can be done by putting data on display on the shop floor. It is usually my least-preferred way, but with some information it is difficult to do otherwise.
One common example is digital information displays, often called Andons (See also my post All About Andon and How to Use an Andon – and How Not To). On such information displays you can usually see the production rate, the quality defects, and the status of the machines.
 It is also possible to put data on paper. Often this is printed, although I prefer handwritten data due to the better involvement of the workers (see The Advantage of Handwritten Data on the Shop Floor). Ideally, this data is shown graphically and easy to understand, using graphs, tables, diagrams, and colors.
The idea is again that the data is right there on the shop floor. This is useful if there is no easier way to visualize the system.
Visual Management with Markings

 Another approach is to mark and label locations on the shop floor. Using different colors you can mark what goes where, and label the places so that the items and tools go to the correct places.
A lot of such markings are actually government regulated. For example, all fire- and emergency-related markings are examples of visual management.
Visual Management with Tools and Parts
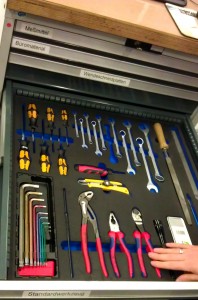 The best type of visual management is if the information about the system can be seen in the system directly. If you create a graph or a data display, there is a chance that it is outdated or simply wrong. Whereas if you see inventory on the shop floor or tools in a drawer directly, the information is up-to-date, and less likely to be incorrect.
Common examples are tool drawers where each tool has its own location. You can see immediately which tool goes where and which tool is missing.

A similar approach is a shadow board, where the shadow of each tool is outlined. The shadow board here was used at Alcatraz prison in San Francisco. At the end of the shift, the guards could see immediately if all knives were returned, or if an inmate was walking around with a potential weapon.
I have seen similar shadow boards for knives in the food industry. The managers there worry less about murders, but they don’t want any tool to go missing and potentially end up in the products.
Visual Management using Layout
 This can also be done with material. A good FiFo lane not only manages inventory but also shows you where your material is, how much more work there is, and many other details on your process.
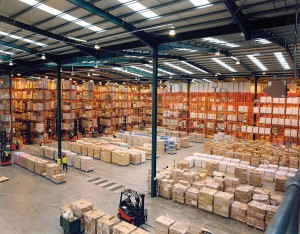
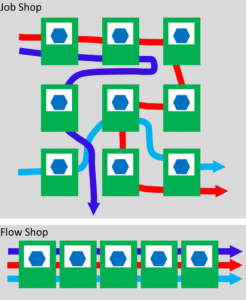 Even the overall material flow can be visualized through the arrangement of the machines. A flow shop is so much easier to understand than a job shop, since the machines are arranged in the product flow. It is much easier to understand where the flow of material is hampered.
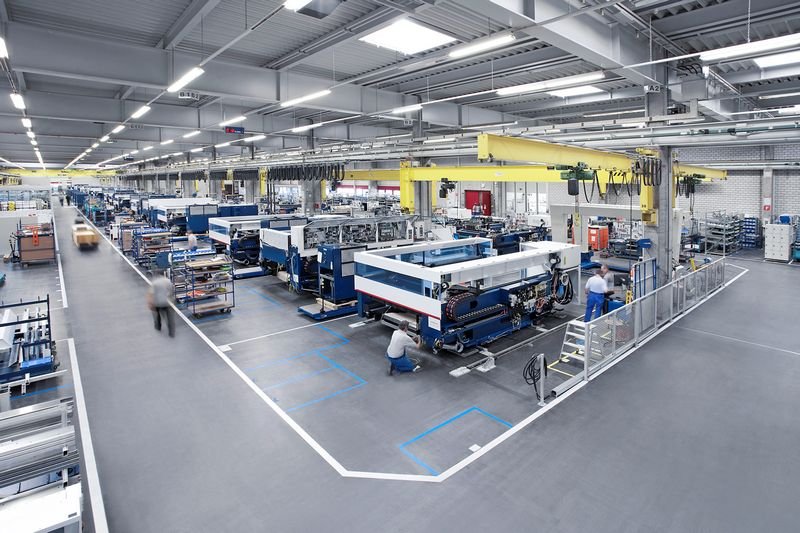
The image below is the shop floor at Trumpf, which I find particularly well organized and easy to understand.
As a counterexample here is an old smithy. Even though it is a much smaller space, it is much more confusing.
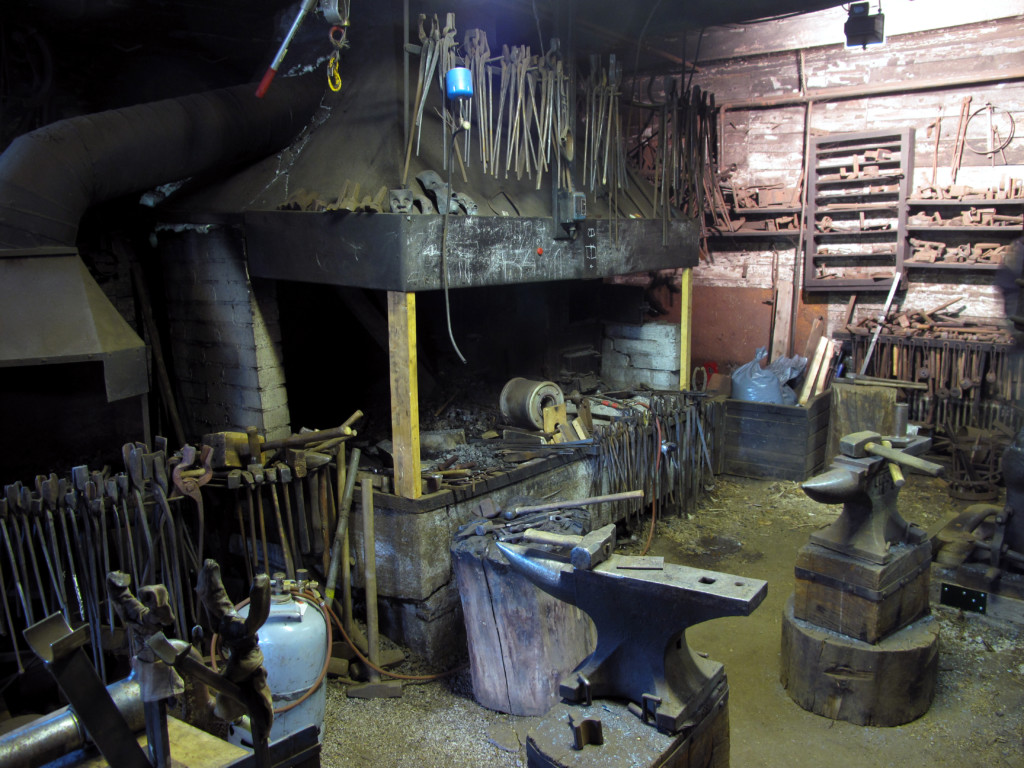
Of course, I have also seen flow shops that were built like a maze, and even the workers that worked there every day had difficulty understanding the material flow. Clarity and structure are not only nice to the pedantic German engineer (me), but actually do have benefits for understanding the system.

Similarly, it is possible to structure your inventories. A supermarket has a dedicated lane for every product. You know immediately how much you have of which material. You can even mark the supermarket with green and red to show when you may get into a critical low-stock situation. This is so much easier than having an unstructured warehouse.
Some Not So Good Examples!
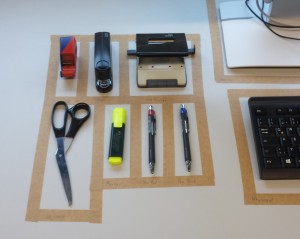

Like everything, visual management can be done badly too. It is particularly easy to overdo it with the markings. The image on the left is staged, but similar examples can be found proudly advertised on the web.
This is overkill. There is no advantage in visual management for individual pens and scissors, especially if it is the personal desk (it may be useful if it is a shared workspace, but even then it may also be too much).
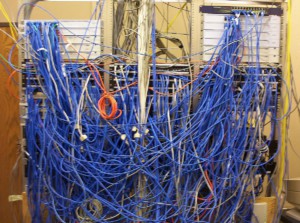
Also, for illustration here is the cabling of two different computer racks. See the difference?

Examples Outside of Manufacturing
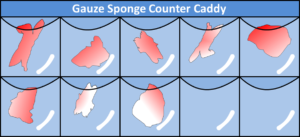 There are also examples in other industries. For example, during surgery, used sponges and gauze are stored in an array of plastic bags or hung on hooks so it can be easily seen how many were returned. The number of surgical sponges after the surgery has to be the same as before, otherwise the surgeon has to go looking for the missing sponge. After all, you don’t want the patient to wake up with something extra.
 For a more positive historic example, see my blog post on Visual Management during World War II – A Visit to the Lascaris War Rooms in Malta. You can find a lot of visual management ideas there before the use of computers. Quite nifty, and open to the public if you happen to be in Malta 🙂 .
Again, the goal of visual management is to understand the situation as quickly as possible merely by looking at the shop floor (or, as a second choice, data displays on the shop floor). So go out, make your factory easier to understand, and organize your industry!
P.S.: This blog post is based on a question by Prashant.
Thanks, Christoph. A great refresher and start to my morning 🙂
Hi, a very good topic! Visualisation is often misunderstood – many people think it has to be something graphic or colorful or sophisticated and designed. But the simplest way to understand the principle is: it is all about how to “read” your environment. Maybe you heard about the most prominent example of people using this skill: Australian indigene policemen working as “trackers” (here a very interesting newspaper article about the last “tracker”). Every human being has the ability to “read” his/her own workplace – almost everybody is able to recognize instantly whether there is an aberration in his/her familiar surrounding or not. The more you train this skill, the more you can react immediately on an aberration, and often enough you can prevent an unintentional situation. You don’t even have to start an analysis, when you just need one glance to see every wrong point. So why not use this skill in a more conscious way?
That is the idea behind it, I think. Mari
I find it useful to distinguish between Visual Management of things, and Visible Management of information, which it too often invisible (if it exists!). As with 5C / 5S, this management should answer all the 5W + 1H questions and so contribute to The Obvious Factory (or other workplace), so that staff can confidently perform their tasks without hesitation or doubt.
Thanks Cristoph, explaining clearly and lot of example so, it easier to understand.
Great overview Cristoph! Thank you. Nice example of historical visual management. You are right it has to be instantly recognisable organization. In the sign industry we have the 3 second rule. If a design/ image looks wrong in the first 3 seconds then it probably is.
Very good and interesting topic . It really helped me as I am doing a presentation on Asset Management and one of the sub topics was Visual Management.
Hi Quanita, glad it was helpful. Recommend my blog to others 🙂
Thank you. I found that to be very interesting.
Good info. It’s one of the skills I’m getting good at at my current job. Being in the area and needing less than five seconds to look around and see what the problems are (experience counts for that).
That being said, there is a huge problem with your photos of the two computer server room examples. The first one is awful, no question about that (then again, anyone who has to work with that PoS will have an excellent signal to pay attention while working on it). The second one has a major (but less obvious) problem as well. It looks neat, but all of the cables look the same and NONE of them have labels as to which switch port each cable must plug into.
If there is a connectivity problem, a technician may have to unplug several cables to troubleshoot the problem. Another scenario is that not all switch ports may be occupied, making it harder to tell where the cable was plugged in before (not the photo, but real life data center).
If you’re lucky, an experienced tech will see it and label them before unplugging anything. An FNG shows up and starts doing stuff while some manager is breathing down his/her neck, you’re asking for trouble.
If cables get miswired and the network goes haywire, you’ll incur major downtime while tracing down each cable along with the documentation (unlikely to exist) where each unlabeled cable goes. Not to mention the typical customer complaints about their servers being inaccessible… Worse yet, some of the cables (particularly fiber optics) may run into storage arrays. Switching those around can (and does) lead to data corruption.
Can we say “ 500TB 3 day backup restore”? 🙂
Nice update. Like with kaizen, visualization can always be improved. Visualization and 5S can also be misused to cover up problems. If the plant looks nice, many people believe it is good.
Thanks ! Good Information on Visual management
Thank you for this simple explanation on visual management. I was lost in it during a job interview because I never had prior understanding about it. This note made it simpler than what I presumed.
Hi Alvin, hope you still got the job. Maybe you can impress your new boss next time he asks 🙂
Thanks for explaining all of this. I personally like to use a tool for visual management purposes. Partially because I travel a lot and sometimes my options are limited, but mainly because the tool I use – kanbantool.com – is very effective. It’s made managing my time and tasks a lot easier for me, it also helps me to save time. I like it.
Very interesting and clear way of working
Distinguish between Visual Management of things, and Visible Management of information