 Inventory is helpful for a fast delivery of goods. If you have it in stock, you can deliver to the customer right away. In that respect, more inventory is better. Yet, at the same time, inventory creates cost, some visible, some more hidden. Hence, one of the goals of lean is to reduce inventory and therefore reduce cost. During my research I stumbled on a very interesting relationship between inventory, customer takt, and replenishment time. Let me elaborate …
The Variables
Before I go into detail, I first want to clarify what I am talking about.
Inventory
 Inventory should be pretty clear. It is all the goods you have, both finished and unfinished. When looking at the relation between inventory, replenishment time, and customer takt, I focus on the work in progress and the finished goods inventory for a certain product.
Replenishment Time
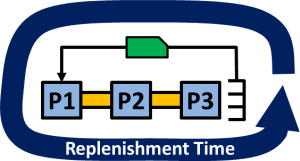 Replenishment time is the time needed to replenish a part. This does not mean when the next part comes down the line, but instead how long it takes for a work order to come back with a part.
Customer Takt
 The customer takt (or takt time) is one of the fundamentals for determining the speed of a production system. It represents the average demand of the customer during a time period. You simply take the working hours for a process or line over a given time period, and divide it by the number of parts ordered by the customer during this period. The result is the customer takt measured as a time per part.
Theoretical Approach
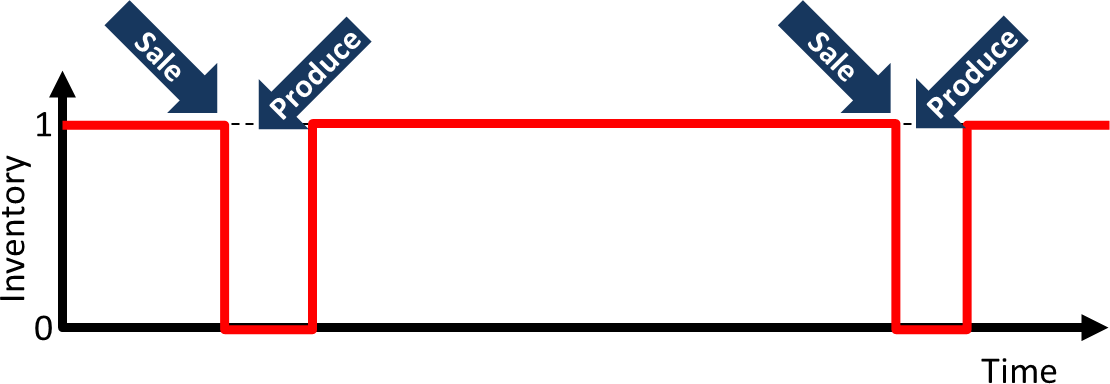
To get a better understanding, let’s start with a theoretical approach. Assume you have one product that sells very, very infrequently (i.e., you have a very large customer takt). Yet, if you want to be able to deliver to the (rare) customer without delay, you need to have at least one of these products in stock. If the customer wants a product, you give him the one in stock, and then reproduce to increase your stock again to one piece. Hence, your inventory over time may look something like the image below.
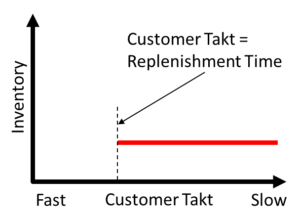 It makes no difference in inventory if your customer takt increases or decreases. As long as you can reproduce faster than the customer takt, you (theoretically) need only one unit in inventory for a near 100% delivery performance.
However, it starts to make a difference if your customer takt becomes faster. At one point the customer wants parts faster than you can replenish within the replenishment time. Hence, even though your system can produce enough parts per minute (i.e., the cycle time or, similarly, the line takt), a new work order takes too long before the customer is back asking for more (the replenishment time is larger than the customer takt).
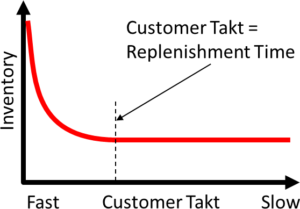 The solution is simple: you increase your inventory. You put multiple units in inventory so the customer can receive a part right away, and multiple work orders are in the queue to replenish. Theoretically, your required WIP would be the ratio of the replenishment time to the customer takt (ignoring variation and fluctuations for now). This relation can also be found in the kanban formula.
Simulation Verification
 To test the relation, we used a simple simulation. We had a single process in a pull production system that was able to produce a part every 9 time units (Pearson-Type-V distributed with α = 4.7778 and β = 34.000). A part was sold to a customer on average every 10 time units (exponential distributed), and the simulation ran for a total of 100,000 parts.
To verify the customer takt without changing the system performance, we produced two part types, with 100,000 in total for each run. We changed the ratio of the part types. For example, we had a simulation with 10 parts A and 99,990 parts B, a simulation with 10,000 A and 90,000 B, and so on. We experimented with different inventories (or number of kanban), and compared only systems of similar delivery performance.
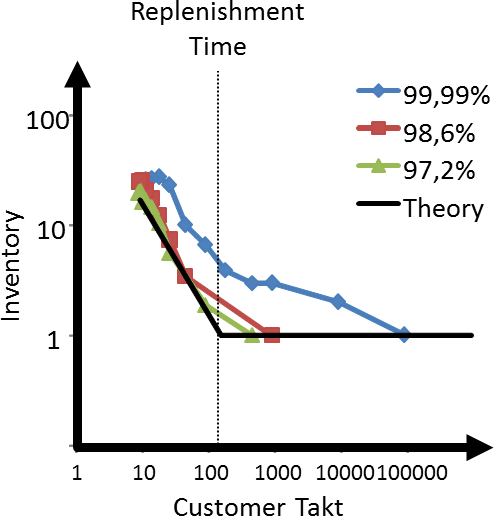
The results are shown in the graph below for different delivery performances of 99.99%, 98.6%, and 97.2% delivery performance. It is stunning how well they fit the theoretical line (shown in black). Please note that the difference in appearance to the diagram above is that here both axes have a logarithmic scale, since otherwise everything would be squeezed too much into a corner. In any case, the simulations have a constant average inventory of around 1 if the customer takt is larger than the replenishment time, and an inventory that increases indirect proportionally with the customer takt if the customer takt is smaller than the replenishment time.
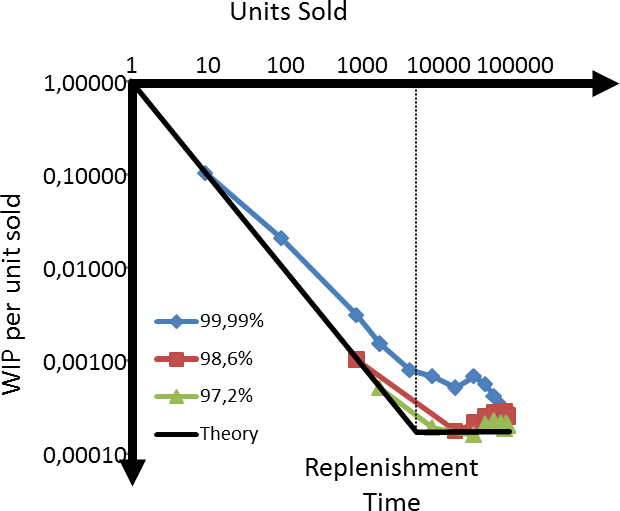
You can also see it the other way round. The graph below shows the relation between the number of units sold and the inventory needed for each unit sold. Again, you see the same relationship, with the bend where the customer takt matches the replenishment time.
What Does This Mean?
Overall, the deciding factor is the ratio of the replenishment time and the customer takt.
- If the customer takt is faster than the replenishment time, inventory goes up proportionally to the units sold, but the inventory per unit sold stays constant.
- If the customer takt is slower than the replenishment time, inventory stays constant, but the inventory per unit sold goes up linearly.
Hence, this relation can help you to estimate the inventory needed.
\[ Inventory= Roundup[ \frac{Replenishment\; Time}{Customer \; Takt}]\]- If the customer takt is faster than the replenishment time, your recommended inventory is the replenishment time divided by the customer takt (plus a safety margin).
- If the customer takt is slower than the replenishment time, your recommended inventory is 1 (plus a safety margin).
Now, you could think that you can reduce your inventory by reducing the replenishment time. Theoretically correct, but practically a bit more difficult.
You could reduce your replenishment time by creating multiple kanban loops. However, the inventory in question applies to a single kanban loop. Hence, your inventory would not change much; it would merely be distributed across two kanban loops. See also my post Supermarket vs. FiFo – What Requires Less Inventory?
You could reduce replenishment time by reducing inventory in the kanban loop. This, of course, would reduce replenishment time. But overall, you would reduce your inventory by … reducing your inventory. It is still worthwhile, though!
I found this relation between customer takt, replenishment time, and inventory quite interesting. I hope it was interesting for you too. In my next post I will discuss how this influences the relationship between the number of variants and the inventory. In the meantime, go out and organize your industry!
Data Source
Meier, Hauke. “Analyse des Zusammenhangs zwischen Variantenvielfalt, Lagerbeständen und Lieferbereitschaft.” Master Thesis, Karlsruhe University of Applied Sciences, 2016.

Important concept. Well explained. Well done.
This is very helpful. Huge thanks to this.