
 Toyota has a nifty way to plan the work of an operator using their standard work charts. In my last post I explained the production capacity sheet to define what capacity you have available. In this post we will talk about the second of the “famous three slips”, the standard work combination table to define when the operator is doing what. A subsequent post will show a standard work layout sheet.
Introduction
The standard work combination table plans the work of one operator during a work cycle. Hence it is useful primarily for manual cyclic work that repeats (nearly) identically for every part produced. Prime examples are any assembly procedures, but it also could include other manual processes that are primarily cyclic. Below is an overview of the worksheet with sample data. Don’t worry about the complexity, as we will go through it bit by bit.

The Header
The header contains the usual stuff found in these types of documents, like part name and part number as well as a date. Below is a zoom-in into the header (split into two lines for easier reading)
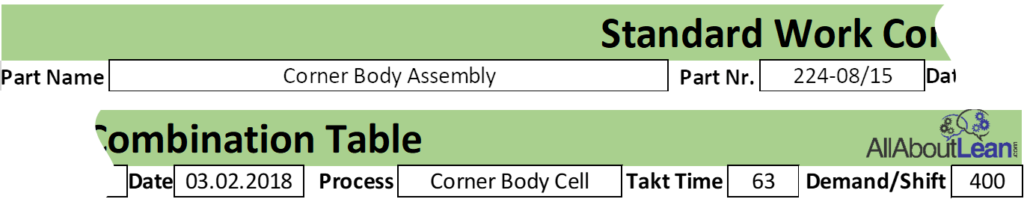
The process is the process to which this standard applies. Depending on your situation, this could be an entire line or cell, or a subsection, a single machine, or even a part of a single machine. It represents whatever the work is that the operator has to do. Remember, this sheet represents only one operator, and multiple sheets have to be created if you have multiple operators.
The takt time is the target speed of the operator. Every how many seconds does he have to complete a part. Please note that the takt time is the average speed, and the cycle time would be the ideal speed. The difference is the different wastes (or losses) like breakdowns, interruptions, lack of material, and so on. These differences are also the OEE. For example, if your OEE is 80%, then you lose 20% of your time due to unforeseen waste. Hence, in this case in the West, we would take a target cycle time of only 80% of the takt time to account for these losses. Toyota in Japan does not do that, and instead uses short-term unplanned overtime to catch up (i.e., the employees can go home if they have reached the target output). This of course makes it easier to plan, but depending on your country or company’s legal framework and the view of the unions, this may not be possible, hence we usually use a cycle time that is faster than the takt time. You have to decide this for yourself, but be aware of this issue.
The demand per shift is simply the available work time during your shift divided by the takt time. In the example above, it is a seven-hour shift (or 25,200 seconds) divided by 63 seconds per part, giving you an available capacity of 400 parts per shift.
The Data Column
The data column lists the work content that needs to be done in sequence. It also contains the duration of the manual work and the duration of the machine-only work for every step as well as the walking distance between the different steps (if applicable). The adding of the data is simple; the challenge is more about getting the data. If you have data sheets available, make sure that the numbers are correct and current. If you have a line to measure and your unions permit measurements, then please check directly on the shop floor.

At the bottom is a row with totals for both manual work time and walking time. I did not forget the total machine time – this simply does not matter. The sum of all machines is irrelevant here! Instead, there is a space to add the waiting time. This is done after the main part of the sheet is completed. The sum of the manual work, waiting time, and walking time is the time needed by the operator, and this should equal the takt time.
The Combination Table
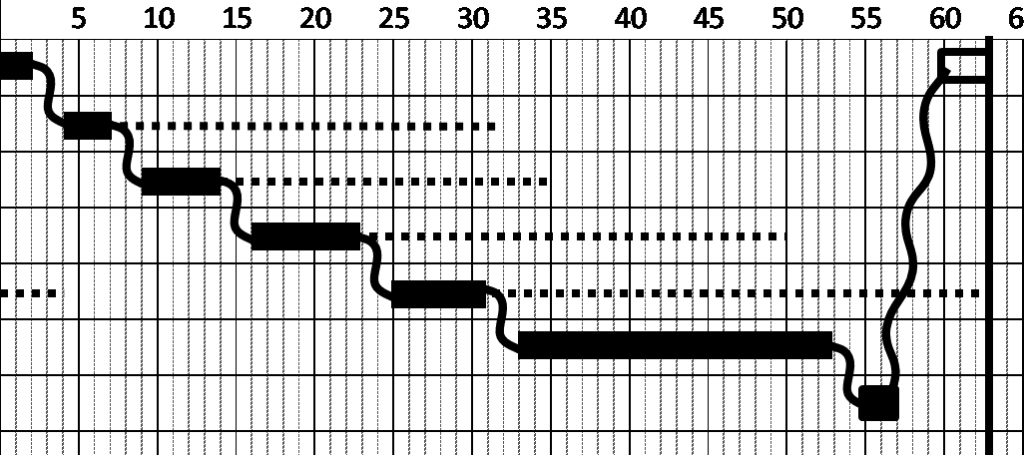
Now comes the interesting part: the combination table. Here you graphically add the different times into a small chart. Below is an example:
Basic Legend
There are a few different features representing different information contents. Below is an overview of a very simple combination table, with the different symbols highlighted. These are the most important symbols, but there are some more in my view optional ones below.
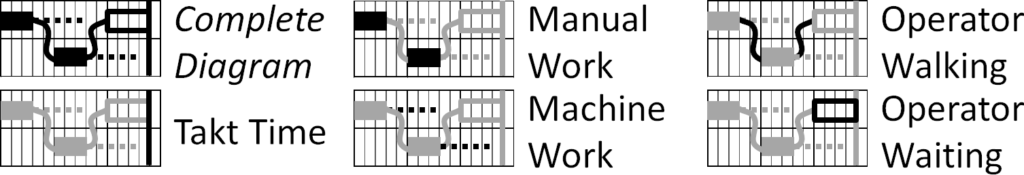
- The takt time is a vertical line. The work for the operator (manual or otherwise) must not exceed this line.
- The manual work is a black rectangle, the length of which represents the time for the manual work. This is the work that the operator has to do, either by himself or with a machine.
- The machine work is a dashed or dotted line. This is the time a machine is working independently from the operator. If the machine works together with the operator (e.g., a manual drill), it would be part of the manual work time.
- Walking of the operator is represented by a squiggly line. The squiggly line also shows how long it takes the operator to walk. This time is difficult to measure, but a rule of thumb is that an operator can walk two steps in one second. Another rule of thumb is that anything above two seconds is too far and you may consider rearranging the machines. The squiggly line may be difficult to do on a computer, but at Toyota these sheets are designed to be filled out by hand, which is better anyway. If the operator works only at one station, walking may not be necessary.
- Waiting time of the operator is represented by a rectangular box, the width of which represents the duration (or sometimes using a double arrow). Waiting time happens if there is time left for the operator between completing his work and the end of the takt time. This is usually at the end of the cycle. However, there may also be additional waiting times in the middle of the cycle if this is necessary for a technical reason (e.g., insert part, wait for a quick machine check, then press button to start). If possible, avoid waiting, since it is one of the seven types of waste.
Extended Legend
For completeness’ sake, Toyota also has three more symbols, although these may not be completely necessary in my view. Below are these variations:
![]()
Nagara Switch Start while walking means the operator presses a switch while walking. These are often so-called Nagara switches that can be activated with a stroke of the hand. This could be incorporated in the previous process. If it is a separate process in between that merely needs to be started, then this symbol may make sense, but then why don’t you start it automatically based on the status of the surrounding processes?
- Work while walking represents the operator doing some work (e.g., putting two parts together) while walking. In my view this could also be represented simply by another line in the diagram.
- Multi-point operation represents a process where the work is done more than once. For example, if you have to add three screws to a part before starting the machine, you would write “3” over the manual work rectangle. This too could be included in the work description.
In my view, these three additional symbols are not completely necessary, but they do not hurt either. As with most methods in lean manufacturing, the goal is NOT to strictly follow some guidelines (except maybe PDCA), but to achieve results. Use the symbols that help you in your work, invent new ones if you see the need, but most importantly achieve your goals!
Some Tips and Tricks
There are some tips and tricks that may help you with using this sheet. First of all, it may not be a problem if a machine time exceeds the takt time. In this case the machine time just continues “at the beginning of the cycle” (i.e., from the beginning of the graph again as shown below).
Sometimes you may have work that has multiple steps or even all of the steps at the same workplace, and the operator does not need to walk between steps. I know of three different ways how Toyota visualizes this situation in the chart. All three of them have a separate line for each sub-step and are shown and explained below.

One way is to simply have a separate box for each work step, and make a vertical line connecting the boxes instead of a squiggly walking line. This would be my preference. Another option is to have a long box covering everything, and make smaller boxes below for the sub-steps. Finally, you can also make one long box and write the numbers of the sub-steps next to it, with a separate line for each sub-step.
You may be wondering why Toyota has three different ways to do the same thing. I believe such methods at Toyota are merely a guideline, and people invent additional ways if needed for their purpose. You should do the same. This sheet is not a religious canon, but a tool that you can shape and adjust to fit your purpose. Make the tool fit your needs, and not the other way round!
 Sometimes you may have the situation that a machine can only start if two separate manual steps are completed. In this case the dashed line for machine operation starts only after the required steps are completed.
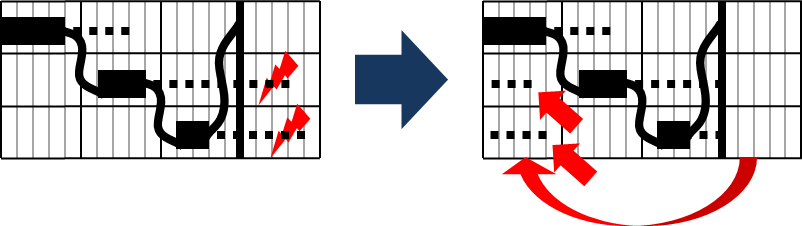
 In some other cases the operator may have to loop back to a previous machine before the cycle is completed. Simply make a squiggly line upward to represent the operator walking back to a previous process. The data columns may have additional information about the time needed for the sub-steps (e.g., “2 / 2” for two seconds manual work in the first and two seconds in the second box). Similar applies to the machine time and the walking time.
 Finally you may have a continuously running machine (e.g., a washer, a dryer). This is represented by a dashed “machine work” line that extends from zero to the end of the cycle.
Benefit of the Standard Work Combination Table
The standard work combination table serves two purposes. First, it helps you to get the work standardized and to create a sequence of steps for the operator to do in his cycle.
More importantly, however, it helps you to improve the cycle. Walking and waiting times are clearly visible in the process, and the total walk and wait time is also summed up at the bottom of the data columns. Hence, it helps you to take away waste out of the cycle. Not quite as visible but also a part of this optimization is to look a the steps itself and see if you can reduce movement (hands, eyes, etc.), for example by placing parts and tools closer.
Goodies for Download
During this short series of posts on the Toyota Standard Work approach, I have used an Excel spreadsheet. For your convenience, here is the spreadsheet as well as a PDF version thereof. Both documents are provided under the Creative Commons CC-BY-SA 4.0 license, meaning you can use them freely, but should give credit to me at AllAboutLean.com.
Okay, this was a longer article, but I do like the simplicity of this approach. Hopefully it can help you in your daily work. Now, go out, make sure your people have cyclic work, and organize your industry!
PS: I learned about this (and many other things) at the highly interesting C2U Lean Leadership Training in Japan and from Michel Baudin.
Originally ‘Man/ Machine Chart’, although some call them ‘simmograms’.
At the end of your post, I was surprised that you wrote that you learned the technique at the C2U Lean Leadership Training in Japan.
Didn’t you learn it when you were working at Toyota? If not then, perhaps in Chapter 7 of Working with Machines?
Kei Abe taught it to me in 1987, mostly for job design in machining cells. For this purpose, I like to describe it as a graphic, manual simulation tool.
He called it “Man/Machine Balance,” but “Man” was already too gender-specific to be used in the US. So we changed it to “Operator/Machine Balance.” John Shook calls it “Standard Work,” which I think is confusing. Finally, I think it was in a book by Kiyoshi Suzaki that I saw them called “Work Combination Charts,” very descriptive, but too long. I shortened it to “Work Combo.”
You claim it is simple. In my experience, however, it packs more sophistication than most IEs can handle. As for production operators, I find that they can be taught to read these charts but not to draw them.
To my knowledge, there is no good software available to support the production of Work Combos. The only reason I can think of is that the market is too small.
Quite interesting!
Excellent !
Excellent explanation.
You can build your Standard Work Combination Table in Excel:
https://polyhedrika.com/2-uncategorised/22-standard-work-combination
Hi
thanks for your post. I have little problem with filling in combination table. Sequence 2-6 is double rows?
Hi Alen, not sure if I understand the question correctly. The rows in the table are sometimes shifted. For example all boxes in the “Walking” column are shifted down 1/2 of a line, since the walking happens between the processes. Does this help?
Hi
that line goes through Work Content from row 1-6 . Look att ex (row 7 machine time fills auto, when i filled cotent above)
http://www.bilddump.se/bilder/20180810063642-155.4.44.149.jpg
Oh, now i get it. That actually was an error in the excel file, where the formatting was wrong. Many thanks for pointing that out. I fixed the file (Excel and PDF) and uploaded it again. It may take a few hours to be updated on all servers, but hopefully after that it is fixed. Many thanks again for pointing out the mistake!
brilliant document, however calculations seem to be somewhat out of sort/not populating the combination table.
Hi Shane, the excel file is quite simple and more of a format to fill out. It does not automatically move the data from one page to the next. There would have to be too many assumptions for this automatic filling out of subsequent pages.
Do you have any documents for type 3 standard work. thank you!!
Hi all, sorry but I don’t have type 3 work documentation (long cycle times and somewhat irregular work). Try to standardize the work content that is more repetitive.
Hi
I Would like to buy templates, How can i acquire them?
Hi Carlos, the excel spreadsheets are here on this page for download. However, the graphics with the wiggly lines and stuff is really hard to do on a computer. It may be best to do it by hand on paper.