
 Toyota is excellent with their standard work. They use a series of worksheets to simplify the creation of these standards. These are sometimes also know as the “famous 3 slips”. The first one is a production capacity sheet to define what capacity you have available. The second one is a standard work combination table to define when the operator is doing what. The third one is a standard work layout sheet to help with the layout and arrangement of the machines. While there are many different ways of doing this, I like the Toyota approach. Since this is a larger topic, I’ve broken it into multiple blog posts. Lets start with the Production Capacity sheet.
Why Standard Work?
 If there are different ways that things can be done, then some of these must be better than others. The idea of standard work helps employees perform consistently. Please note that any good work standard – or even any good working procedure – needs a lot of input from the people who actually do the work!
The naming of this method and the three sheets that I will show you in this and the next two posts is by no means used consistently across the lean community, and there are many different similar names. At Toyota this is known as Standard Work, which is also the name John Shook uses. However, this may lead to confusion with the more general standardized work or work standards (meaning there is a standard of some kind, but not necessarily this method). Kei Abe called it Man/Machine Balance, but this was not gender neutral and hence was changed to Operator/Machine Balance in the USA. Kiyoshi Suzaki calls them Work Combination Charts, which Michel Baudin shortened to Work Combo. Definitely many thanks to Michel Baudin for letting me know all those many names and their origins.
Where to Use It
The production capacity sheet helps with the calculations of the line capacity, and the standard work layout helps with the line layout. The standardized work combination table defines the working standard of the operator. Each of these address a specific issue in planning and standardization.
Preparations
 Before we can start, we need a few pieces of information.
We need to know what the line has to do. The different process steps need to be defined or known. Ideally, we already have a line, but it would also work for a yet-to-be-built line as long as we know the process steps.
We need to know the target speed of the line. How fast should the goods be produced? Key metrics here are the cycle time and the customer takt (or line takt) (the ratio between the two is the OEE). The resulting metric here is the target cycle time. How fast should each machine be (without breakdowns, delays, and other losses) measured in seconds (or minutes, hours, etc.) per piece?
We need to know the speed of each machine, including the time needed for the operator and the time needed at which a machine can work without the operator as well as . At Toyota, this is usually measured using stopwatches (if the line already exists). Other countries where the unions disagree with stopwatches need to use different methods, usually a system of predetermined motions (e.g., MTM). The key metrics here are the manual work time and the additional machine work time. This is such important data that Toyota has a standard sheet for this purpose, the “Production Capacity Sheet”:
Production Capacity Sheet
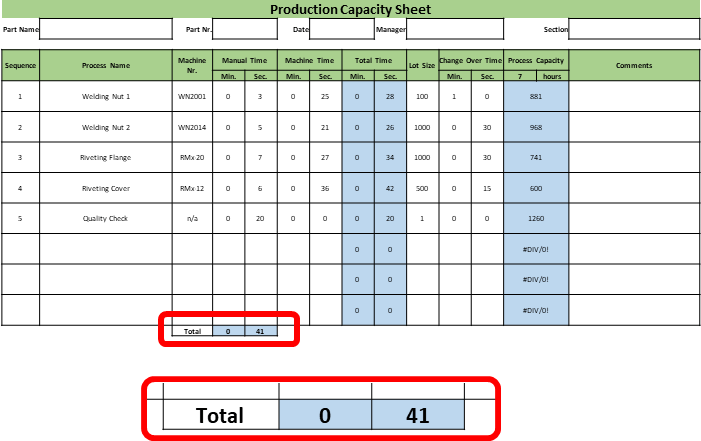
The production capacity sheet is an overview with the basic data and some simple calculations regarding the machines in the line. I have created an Excel spreadsheet, based on the Toyota spreadsheet, which also does some simple calculations. Below is the overview of the sheet, but since it is a bit small, let me break this down into pieces:
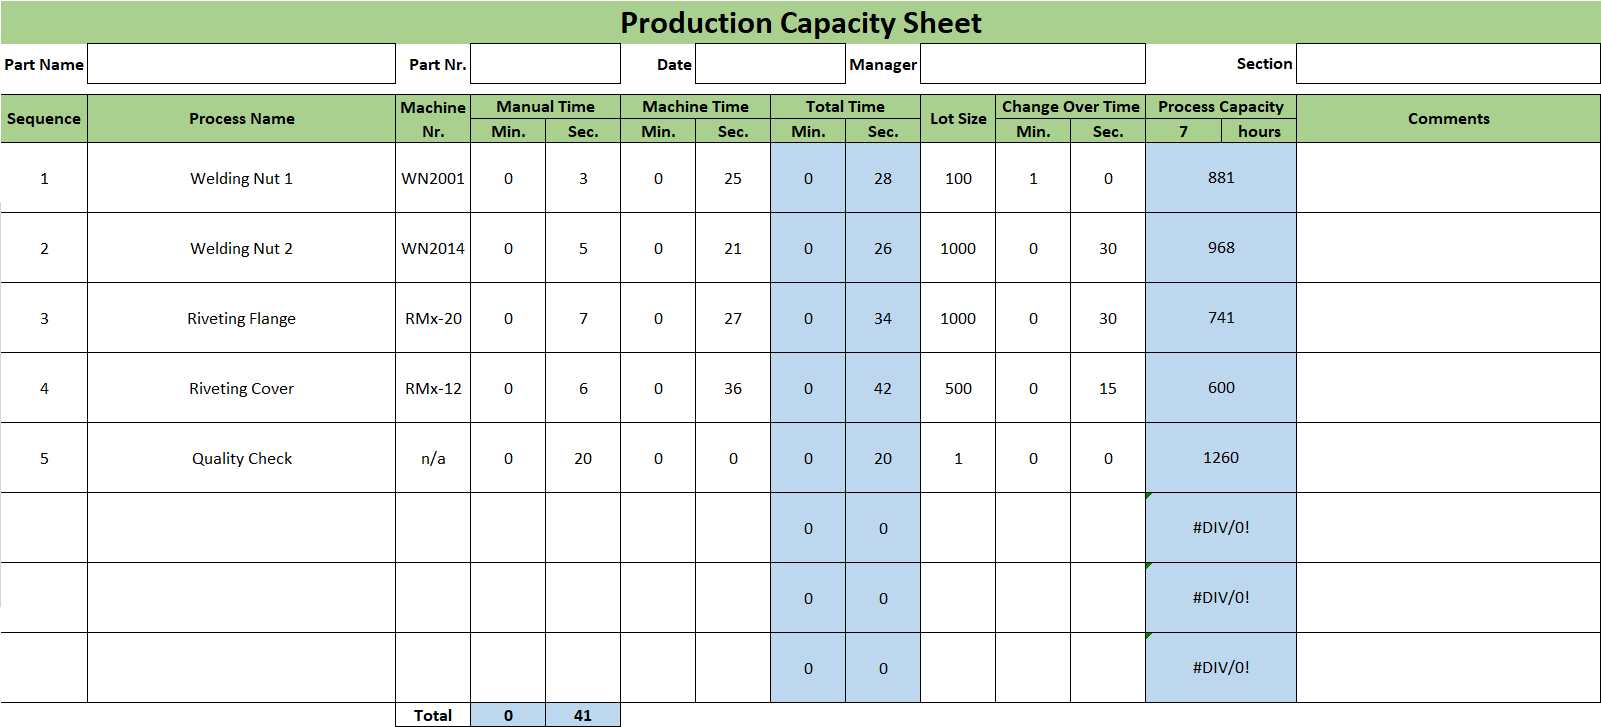
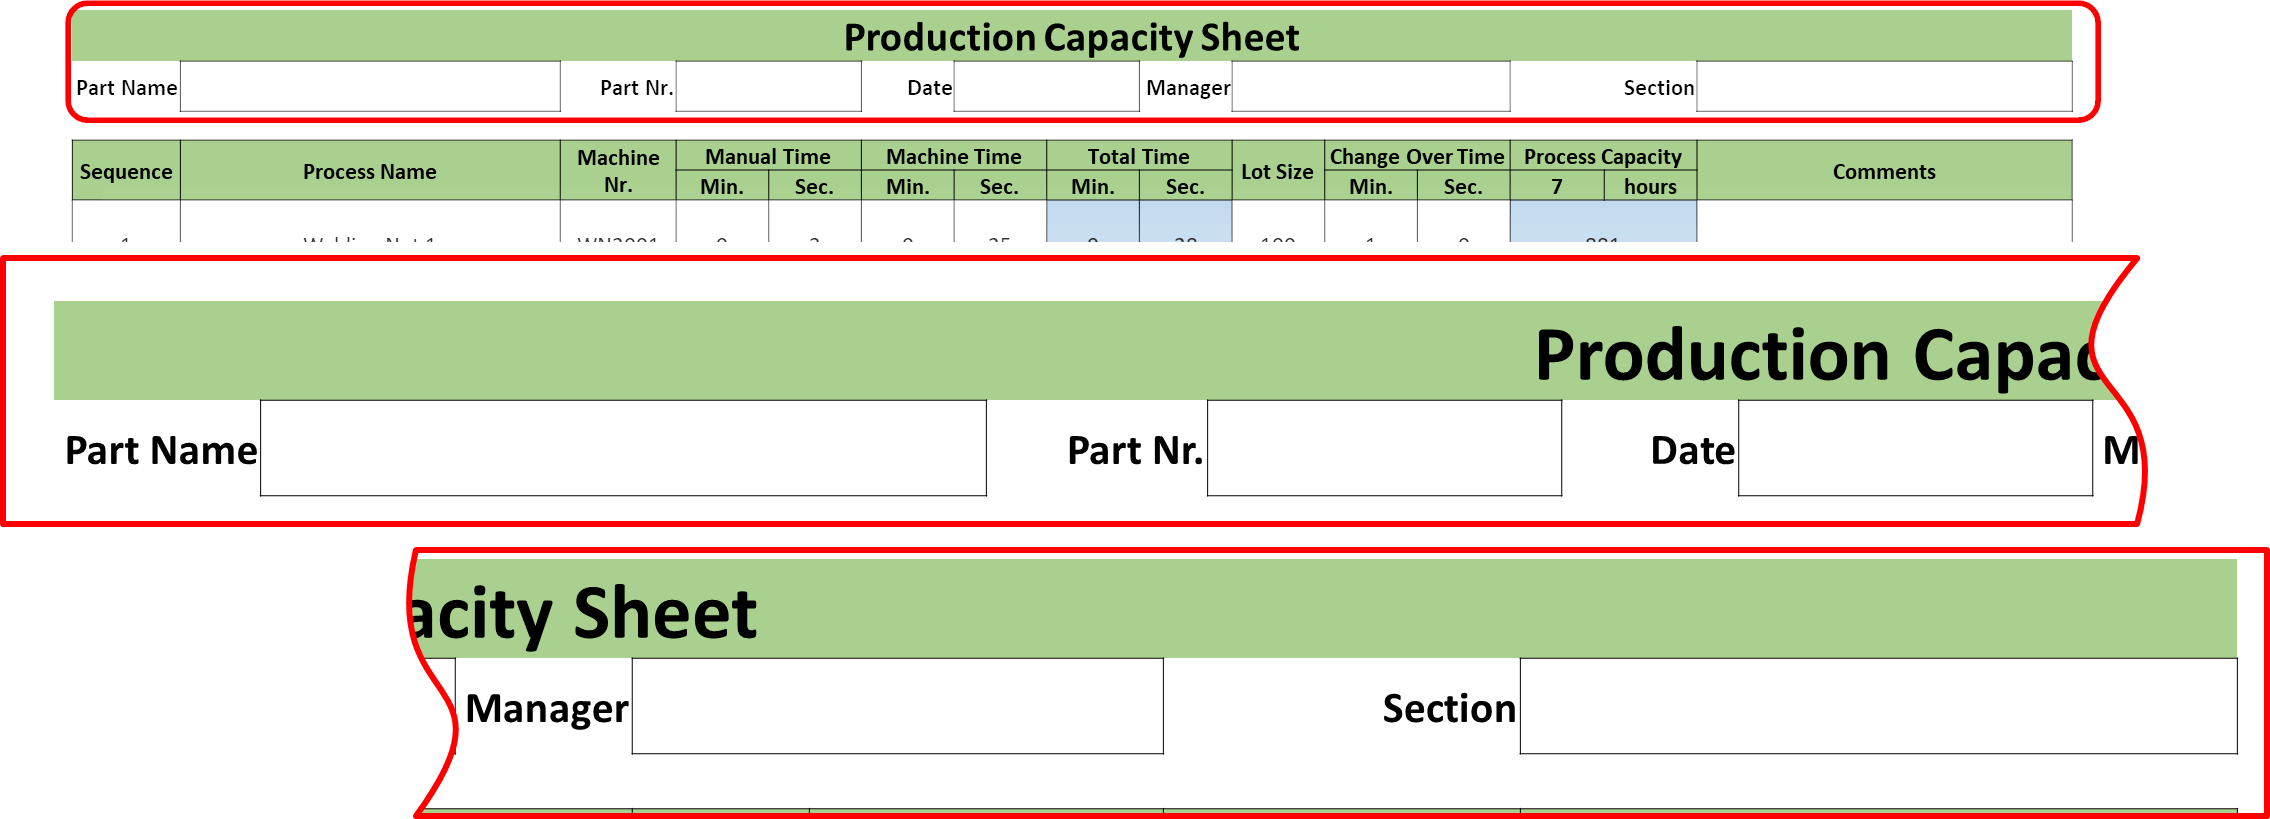
Production Capacity Sheet Header
The header contains the usual things you find in the headers: The name of the part to be produced, the part number for the software system, a date, a responsible person, and also a plant section. An example is given below. Feel free to modify these as needed in the Excel sheet.
Production Capacity Sheet Process Times
Next we get to the actual data. We list the processes/machines that have to be done. Below is the detail from the data sheet, filled in with example data.
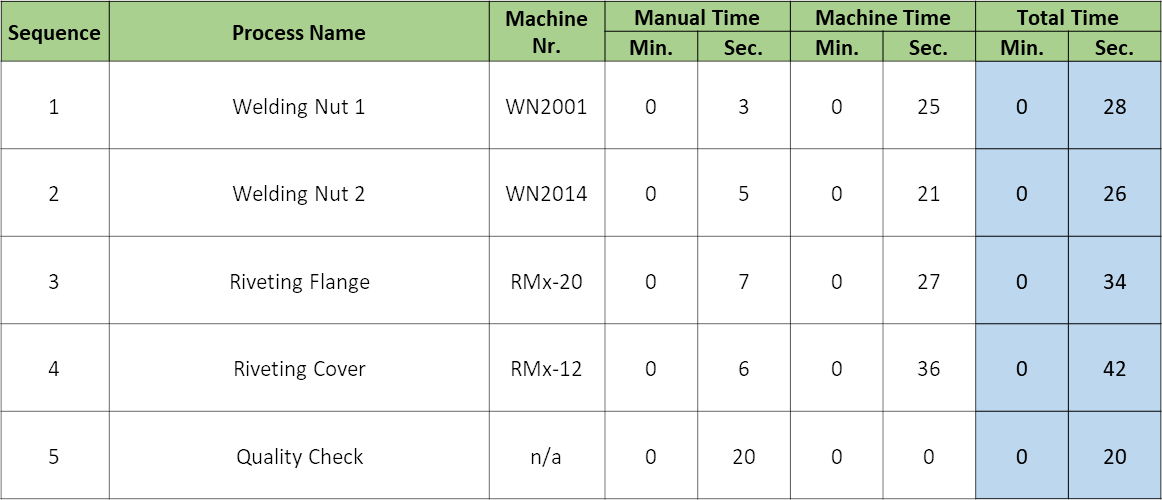
First add the machine names and numbers in sequence, so you know which machines you are talking about. Next add the working times, distinguishing between manual work time and machine-only work time. The spreadsheet will calculate the total time for you.
All machine times would have to be faster than the target cycle time. If a machine is slower than the target cycle time, it won’t have enough capacity to supply the customer. You need a faster machine or a second machine.
Production Capacity Sheet Change Over Times
In the next few columns comes the info on the lot size and changeover time. As you can see below, you add the lot size and the duration of the changeover into the cells. You can also change the duration of a shift in the header below process capacity (here 7 hours).
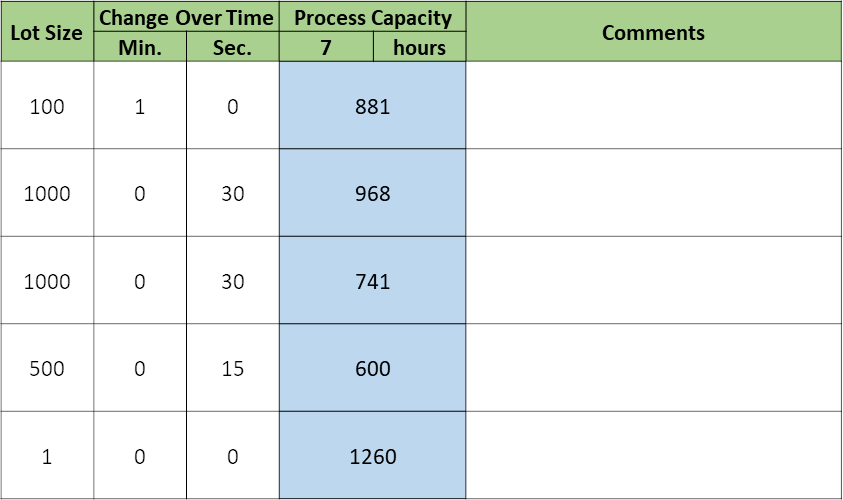
The Excel sheet will automatically calculate the maximum process capacity based on the manual and machine work times and the changeover time. This capacity is simply calculated as follows:
\[ { \text{Process Capacity}=\frac{\text{Operating Time}} {\text{Manual Time + Machine Time +}\frac{\text{Change Over Time}} {\text{Lot Size}}}}\]Production Capacity Sheet Totals
Finally, you will see a “Total” line at the bottom. Curiously enough, this is only for the total of the manual work times. But, if you think about it, this makes total sense. The total manual work must be less than the target cycle time, otherwise the line is too slow. Hence, this number is needed. The total for each individual process is in the “Total Time” column already, needed to check if the machines are fast enough. Having a “Total of the Total” is of little use here. Hence, even though it is easy to calculate the totals of the machine time and the total of the totals, you don’t need it, and hence you do not clutter the sheet with unneeded information.
Goodies for Download
During this short series of posts on the Toyota Standard Work approach I have used an Excel spreadsheet. For your convenience here is the spreadsheet as well as a PDF version thereof. Both documents are provided under the Creative Commons CC-BY-SA 4.0 license, meaning you can use them freely, but should give credit to me on AllAboutLean.com.
Now you have the data basis to do the standard work. I will describe the standard work combination table in the next post. Hopefully, this was not too dry for you, and I promise it will all start to make sense in the next post. Until then, stay tuned, and go out and organize your industry!
PS: I learned about this (and many other things) at the highly interesting C2U Lean Leadership Training in Japan and from Michel Baudin.
Series Overview
- Toyota Standard Work – Part 1: Production Capacity
- Toyota Standard Work – Part 2: Standard Work Combination Table
- Toyota Standard Work – Part 3: Standard Work Layout
“Key metrics here are the customer takt (or line takt) and the cycle time (the difference between the two is the OEE).”
Customer takt is the time you need between two consecutive finished products to fulfill customer demand? And cycle time is the actual time that the machine takes for this? OEE is theoretical output when production is perfect minus all the losses on the machine (e.g. Quality, downtime, rate loss) – so if 20 out of 100 minutes are lost, OEE is 80%?
Example: If my clients request a new car every 10 minutes, I can produce one ever 5 minutes, but due to some losses I am producing one every 10 minutes only. The difference between takt and cycle time is 0. But my OEE is not zero (and not 100% either). Could you please elaborate?
Hi Koen, your customer takt equals your line takt and is 10 minutes.If your cycle time is 5 minutes, then your OEE is 5min/10min (Cycle time/takt time) = 50%. Half of your time is useful, half are losses. Hope this helps.
Hi Christoph,
great read, truly enjoying your articles and appreciate the effort that went into them!
I disagree with the definition of OEE though. To my understanding OEE is measured against ideal cycle time of a machine by evaluating three losses (running slow, defective parts and downtime). The loss you’re describing is over capacity and would result potentially in low OEE due to underutilised equipment.ost likely the business would decide to only run process for a portion of the day and therefore the waste would not necessarily be captured by low OEE but wasted capital having bought a machine with too much capacity. What are your thoughts?
Kind regards,
Wolf
Hi Wolf, the OEE is the ratio between the cycle time (which in my definition is the fastest repeatable speed) and the line takt. When planning a line, you may not have the line takt yet, hence you take the customer takt and make a best guess of the OEE of the line to get to the cycle time. Not sure if I understood your comment correctly.
In any case, Toyota does not have this problem, as they assume customer takt = cycle time, and make up the losses at the end of the day with overtime.
Hi ChristChr,
takt is commonly defined as the amount of products a customer pulls in a given time span. OEE is not directly connected to it as it is the performance of equipment (or a process) to it’s capacity. Some companies try and match cycle time to take time (customer demand) but this is not a necessity. An example would be a customer demanding 100 pieces per day while our line is capable of making 200. In that case we would most likely stand the line down for half a day to avoid over productio thus running at 100 percent OEE. On the contrary we could run the line all day long and would be running at 50 percent. Utilisation and OEE are measures closely linked in planning but not always a function of each other. While takt time ist the external demand against capacity OEE is the performance of equipment against its (internal), theoretical, maximum capacity.
Apologies for the convoluted explanation.
Does this clear things up?
Kind regards,
Wolf
Hi Wolf, I think you got the takt upside down. The customer takt is the time span divided by the amount a customer pulls (not the other way around). For this you do not need the OEE. This is the *customer* takt. Similarly the line or machine takt is the time span divided by the amount produced. Ideally, the line takt is about the same as the customer takt (otherwise you will get the problem of low utilization as you described above). The cycle time (fastest repeatable time per part). The OEE is needed to get from the customer or line takt to the *target* cycle time if you want to know how fast your line should be. Does this help?
good
I disagree with the definition of OEE as it pertains to equipment that runs multiple part numbers over the course of a day or week. For example, a stamping press can run a variety of part numbers for as many customers. The cycle time for a given stamping may be 30 parts per minute while the Takt time for the given part is 30 minutes.
The OEE calculation will be based on my scheduled time to run a given quantity of parts on the machine, not the takt time based on customer demand. If I need 3000 parts and the OEE for the process is 70%, I’ll allocate 2.4 hours for the work. OEE is not dependent on the Takt time where I come from. Rather, the typical “run @ rate” capacity is usually 85% of available capacity or less so as to accommodate volume variance of up to 15%.
Hi Redge, the OEE explanation here is very simplified, but still works. For multiple parts you have to figure out the share of the work time for that part (as you did), and also could aggregate it up again to an overall OEE for the machine.
The second question is the customer takt (what is needed) or the line takt (what was actually made). Ideally these should be similar, and your system makes just as much as the customer needs. In the long run they will be similar. For the OEE i usually use the line takt, and the OEE is how fast I could have been if everything went perfect (cycle time in time per part) divided by how fast I actually produced (line takt in time per part). More details on my series of posts on the OEE.
Hi Christopher,
Let’s say the operator can process 4 parts (1′ per part) so manual time would be 4 minute, but the oven can only process a batch of 2 these means 2 parts are on Queue and 2 parts are going into the oven. What do you put as a batch 2 or 4? or Would you change the manual time to 2′? So you can standardize the batch size.
Hi Michael, not quite sure if i understand the question correctly, but let me try. You need to distinguish between the overall speed and the fluctuations. The operator can make 1 piece per minute. Then the oven should be able to do 4 pieces in 4 minutes, and hence also 1 per minute in average, just with more fluctuations (you get 4 at a time, then nothing for the next 4 minutes). You need a buffer before (and probably also after) the oven, that can collect 4 pieces for the oven to process. It becomes more complicated if the oven can make only one product type (i.e. grill chicken and beef, but not together), then your lot size should be at least 4 pieces, and more if you may need a changeover (clean your oven so that the beef does not taste like chicken).
Hope that helps.
Hi Christoph,
First of all, my compliments for the quality of information you are providing!
I have a question about total manual time which you say should be lower than target cycle time. Is this also valid if the manual time is done by more than 1 person? I understand the logic if we apply it to a process where 1 single persons is doing all the activity, but not if there are 2 or more persons.
Thanks,
Koen Lagae
Hi Koen, thanks for the compliments. The time is the work per person. If two people are doing a job, the workload at this station could be double, but each person still has to match the target cycle time. If one person has more workload than the target cycle time, changes are that with losses he may be slower than the target takt time, and you whole line has to slow down.
Thanks