
 It is common in industry to measure the utilization or the closely related OEE. It is a bit more difficult, however, to set targets for these KPI. Often you hear people wanting or demanding an OEE as high as possible, with a long-term target of ideally 100%. That is often problematic. The utilization or OEE is unfortunately not a clear cut target that you can simply maximize. Let me explain…
Introduction
OEE is short for Overall Equipment Effectiveness (or sometimes Overall Equipment Efficiency), and is a measure closely related to utilization. It tells you how much you produced compared to how much you could have produced at most, theoretically, in the same time. In other words, if you have an OEE of 80%, you produced 80% of what your system could have produced if everything went perfectly. The OEE can be calculated in two ways, giving identical results:
\[ {OEE = \frac{Minimum \; Time \; to \; make \; Parts \; under \; ideal \; Conditions}{Actual \; Time \; needed \; to \; make \; Parts}}\] \[ {OEE = \frac{Number \; of \; Parts \; produced}{Parts \; that\; could \; have \; been produced\; in \; the\; same \; Time\; under\; ideal \; Conditions }}\]In both cases you compare the actual time or output with the time or output that would have been possible under ideal conditions (i.e., nothing goes wrong, no breakdowns, defects, etc.). The OEE should be a number between 0 and 100% – although with number fudging you sometimes see values over 100%.

I have written a lot about OEE before, including what it is, what OEE is good for, how to measure it, and also some alternative ways to calculate it and many measures similar to OEE.
OEE above 100% – Your OEE Is Wrong
![]() First, let’s get one thing out of the way: an OEE above 100% is bogus. An OEE is a percentage of what is possible under ideal, perfect circumstances (i.e., the maximum speed). If your OEE exceeds that, then you are either working faster than physically possible, or you are fudging the numbers. Pardon me, but I don’t believe that you can break the laws of physics, hence I won’t believe any OEE above 100% – although I have seen quite a few claims to OEEs above 100%.
First, let’s get one thing out of the way: an OEE above 100% is bogus. An OEE is a percentage of what is possible under ideal, perfect circumstances (i.e., the maximum speed). If your OEE exceeds that, then you are either working faster than physically possible, or you are fudging the numbers. Pardon me, but I don’t believe that you can break the laws of physics, hence I won’t believe any OEE above 100% – although I have seen quite a few claims to OEEs above 100%.
Target OEE at 100% – No, You Don’t Want That
So, if above 100% is not possible, what about 100%? This should be the maximum possible speed, and we should aim for that, right? Sorry, no. For this I actually have to dig a bit deeper. OEE, and in relation the utilization, has an inverse relationship with inventory. If your inventory goes down, so will the utilization. If your utilization goes up, so will your inventory. The graph below is derived from the Kingman equation. For a simple single-arrival single-process system, it shows the waiting time in relation to the utilization. The waiting time represents the number of items waiting. The higher the utilization, the higher the waiting time. Unfortunately, it is not a linear relation, but an exponential one, and the waiting time for a 100% utilization is infinite.
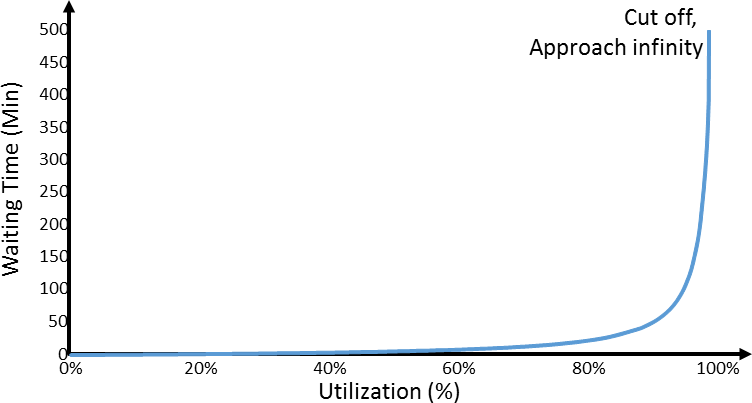
This means that if you want a utilization of 100%, you are willing to have an infinite inventory. In lean, large inventories are bad, and infinite inventories are as bad as it gets. Luckily, infinite inventories are not possible, and hence 100% utilization is not possible either.
The Kingman equation is a simplified system, but you will find similar behavior in all production systems. For example, if you make products on order (make-to-order), then your utilization usually goes up with the number of orders you have. However, the more orders you have, the longer each order has to wait. For a 100% utilization, you would need an infinite number of customers waiting.
Fluctuations
Naturally, there are ways to reduce inventory despite high utilization, and that is by reducing fluctuations. The second important input to the Kingman equations are the fluctuations. The higher the fluctuations, the higher the inventory or waiting time in your system for the same utilization (or the lower the utilization for the same inventory). The relationship is shown below again for different exemplary levels of fluctuation. I added this, since I feel that managing fluctuations is often ignored or neglected on the shop floor.

In any case, regardless of the level of fluctuations, they all approach infinity as the utilization approaches 100%. Hence, again, 100% utilization is not possible.
Make-to-Order vs. Make-to-Stock

Before we will look at what a good OEE is, we should make one important distinction. Are you producing on order (make-to-order) or is the product on stock (make-to-stock)? With make-to-order, the lead time is usually critical for the customer, and the number of open or worked-on jobs should not get out of hand. Make-to-stock, however, can not only have larger inventories, but actually needs larger inventories to have items for the customers when they need them. Hence, very generally, you can have higher OEEs for make-to-stock production than for make-to-order production.
Common OEEs in Industry

When in the industry, I am often presented with OEEs of 70–90% in mass production of make-to-stock items. However, whenever I dig deeper, I find lots of funny things unusual ways to calculate the OEE, like taking out maintenance time and other things that make the OEE look better but less stringent. For details, see my sarcastic article on fudging the OEE. If I would have done a more stringent calculation, I would get OEEs of 60–70% for not-outstanding-but-also-not-bad companies. The lowest OEE I have actually measured in mass production was around 30%, meaning 70% of the machine capacity was wasted. That was a not-so-good company.
Bottleneck or Not?
Before I finally go to the different ranges of OEE, one more comment: The OEE is usually only relevant for processes that are bottlenecks or, more generally, limit your output. If you want more parts, you should improve the bottlenecks (and this may be more than one machine at different times). For more on bottlenecks and their detection, see my series on bottleneck detection.
If a process is NOT the bottleneck, then its utilization does not matter, and usually the OEE does not either. (Small caveat: if it is highly inefficient, you may still improve it to reduce the time of the workers, but this is not a measure to get more parts out of your system). But overall, focus with your OEE on your bottlenecks.
One anecdote: I know the story of one smaller company that bought an expensive primary machine. Since it was expensive, the thought was that the machine should run as much as possible. Yet, the customer did not buy enough product, and the machine was just filling up warehouses with products that got old and tied up cash. If your customer is not buying enough, then the OEE should not be used to justify more production, but could be used to produce more efficiently.
What Are Good OEEs?
 So, let’s have a look at what I consider a good range of OEEs. This is only my personal opinion, and (unfortunately) not based on a lot of data, the problem being heavy number fudging of OEEs all over industry. Also note that these are for OEEs that are calculated stringently, and not the generous “I need goo numbers” type of OEEs that are unfortunately all too common. I believe for make-to-stock production, having an OEE of 80–90% is outstanding. If the OEE is above 90%, then you are getting too much toward the danger zone of infinite inventory. For make-to-order production, I would go a notch lower and consider 70–80% OEE (stringently calculated) an excellent value. This (and ballparks for good, average, and bad OEEs) is shown in the table and graph here. Again, this is only my opinion.
| Ranking | Make-to-Stock | Make-to-Order |
|---|---|---|
| Too Much! | >90% | >80% |
| Benchmark | 80-90% | 70-80% |
| Good | 60-80% | 50-70% |
| Average | 40-60% | 30-50% |
| Bad | <40% | <30% |
So, this concludes the post on what I consider a good OEE. I hope this was useful, and I hope that your (stringently calculated) OEEs are not too far away from where you want them to be (again, not 100%!). Now go out, get your OEE to a good range, and organize your industry!
Half a century or so ago my first Supervisory job was running a fishcake line. Daily performance was calculated on our ‘Efficiency Reports’ which effectively used the same equation, although we used Availability x Utilisation x Quality. Years later I heard the tern OEE which included ‘Performance’ – thank goodness you use ‘Speed’! I still prefer Utilisation: our lead machine was set at 240 packs per minute, but the crew couldn’t fill every slot for very long, so we were not -in theory- fully utilising the equipment.
On a monthly basis we received material yield costings. Product weight was also important: lightweights were illegal, so our target weight was something like nominal + 3SD. We lost the odd lightweight. It would have been easy to increase weights and avoid lightweights, therefore upping the ‘OEE’ – but to the detriment of our costs …and of course we’re in business to make money, not win prizes for best OEE.
When the UK joined the EEC lightweights became legal – we just had to demonstrate that average weights were in spec. 2oz fishcakes also became 50g. Kerching! £££!
one thing is to ensure TPM is within the available time, as good practice to reduce TPM time through kaizen. similar arguments for SMED.
OEE is TAKT Time / CT in short. That is it. What we produce is not good part but goods for exchange. Only goods can be exchanged is good part.
I know a company that has a fix target % for OEE regardless of the lotsize. Fix change-over cycle times can not be crushed due to compliance/technical reasons. It surprises me that they have in reality variable lot sizes, depending on the output of the previous input, and still rely heavily on the actual vs target for this measure.
The OEE really depends on the theoretical time that the process is available. If one calculate the OEE per shift its for example 8 hours, the OEE normally gets rather high. If you use 24/7 as the theoretical time then the OEE gets low. For example if the process runs in thre shifts Monday to Friday the maximum OEE you can reach is 5/7*100 = 71 %. A normal “OEE” of 70 % during the 5 days will result in an OEE of 49%.
This is an interesting article, thank you!